GGPLOT - lims
Modify axis, legend, and plot labels and then convert them with ggplotly
p <-
 ggplot(mtcars, aes(mpg, wt)) +
  geom_point() +
  xlim(15, 20)
plotly::ggplotly(p)


p <-
 ggplot(mtcars, aes(mpg, wt)) +
  geom_point() +
  xlim(20, 15)
plotly::ggplotly(p)


p <-
 ggplot(mtcars, aes(mpg, wt)) +
  geom_point() +
  xlim(NA, 20)
plotly::ggplotly(p)


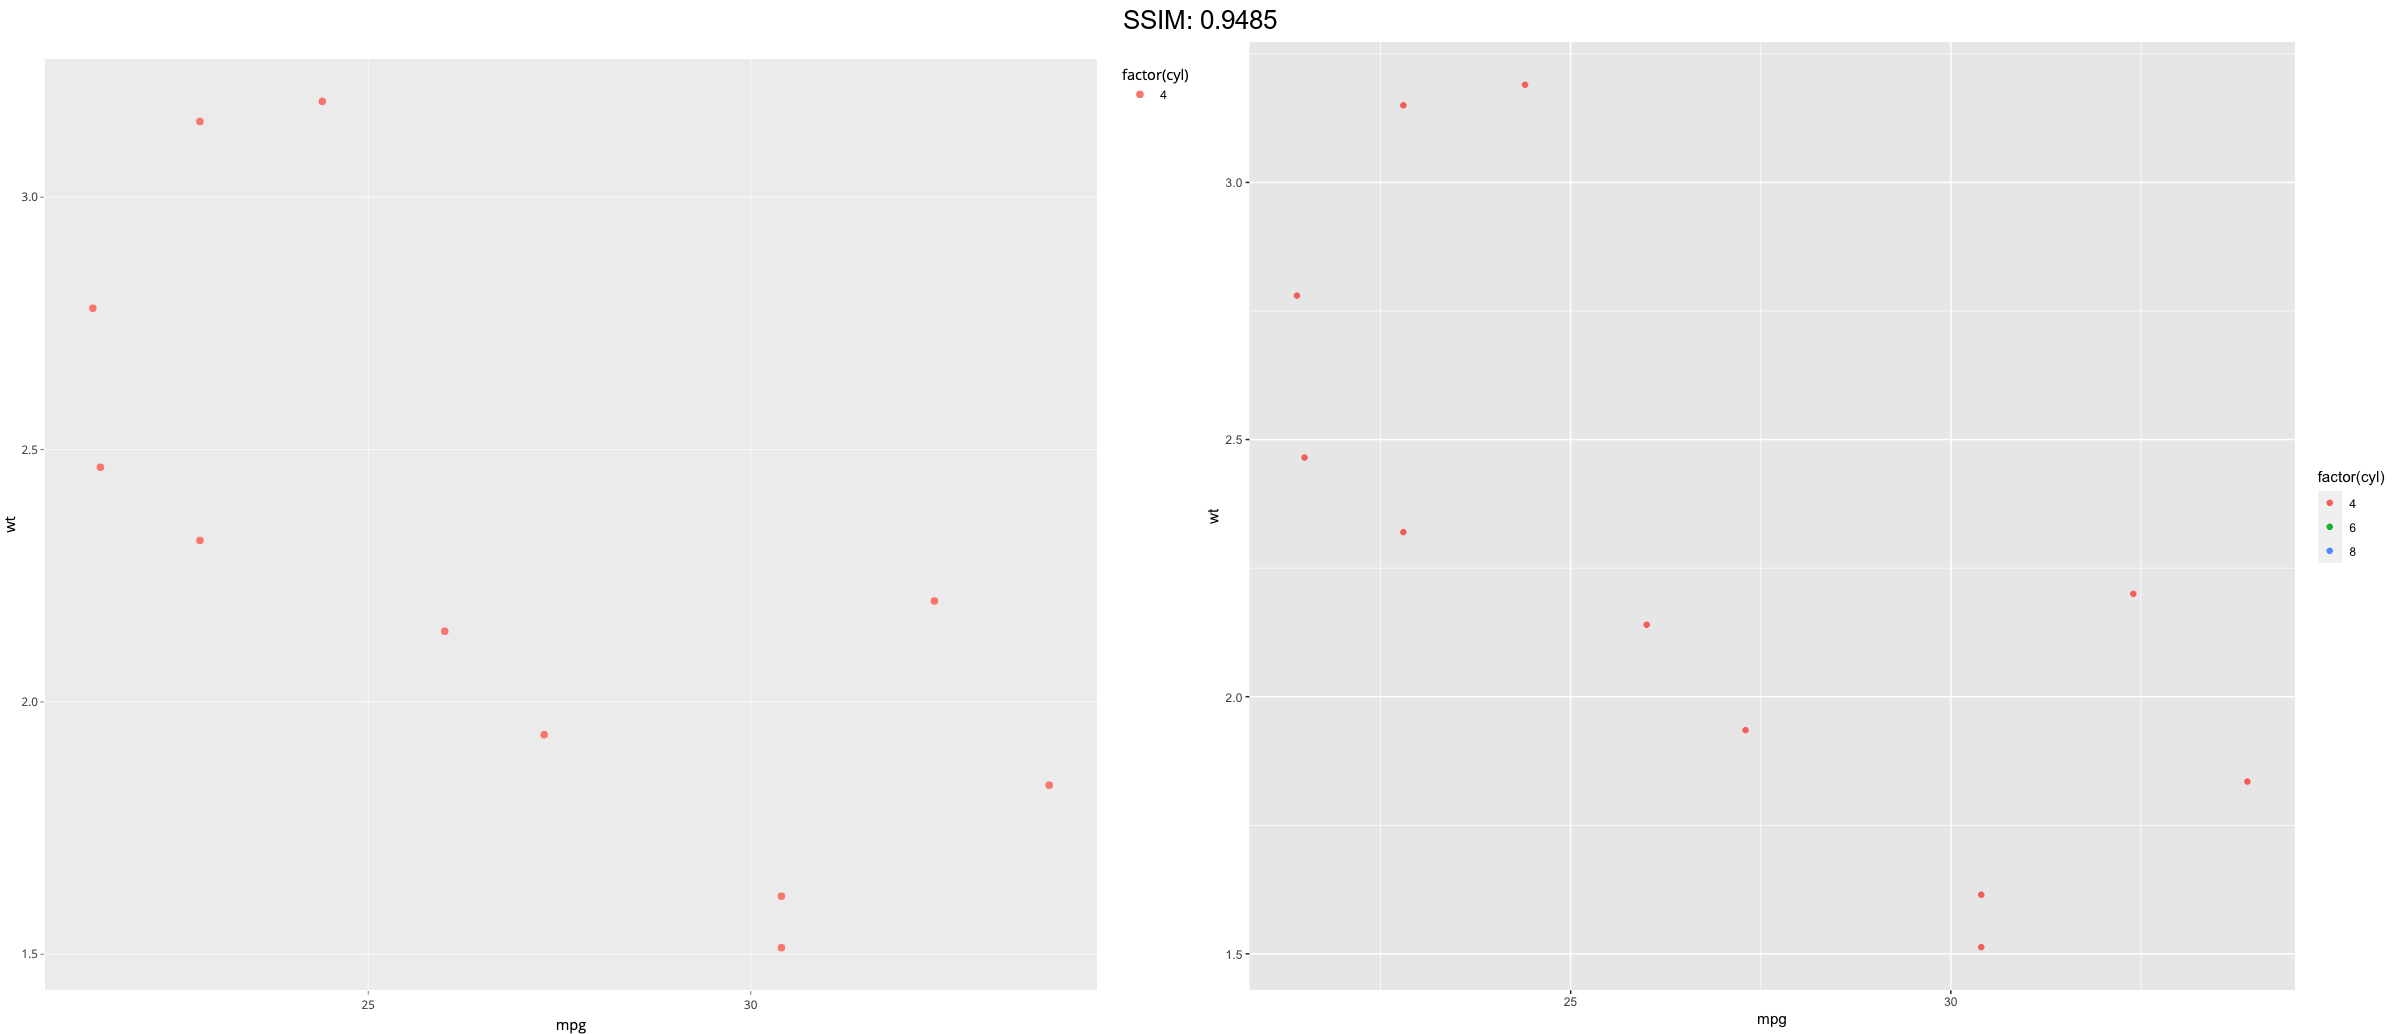
small <- subset(mtcars, cyl == 4)
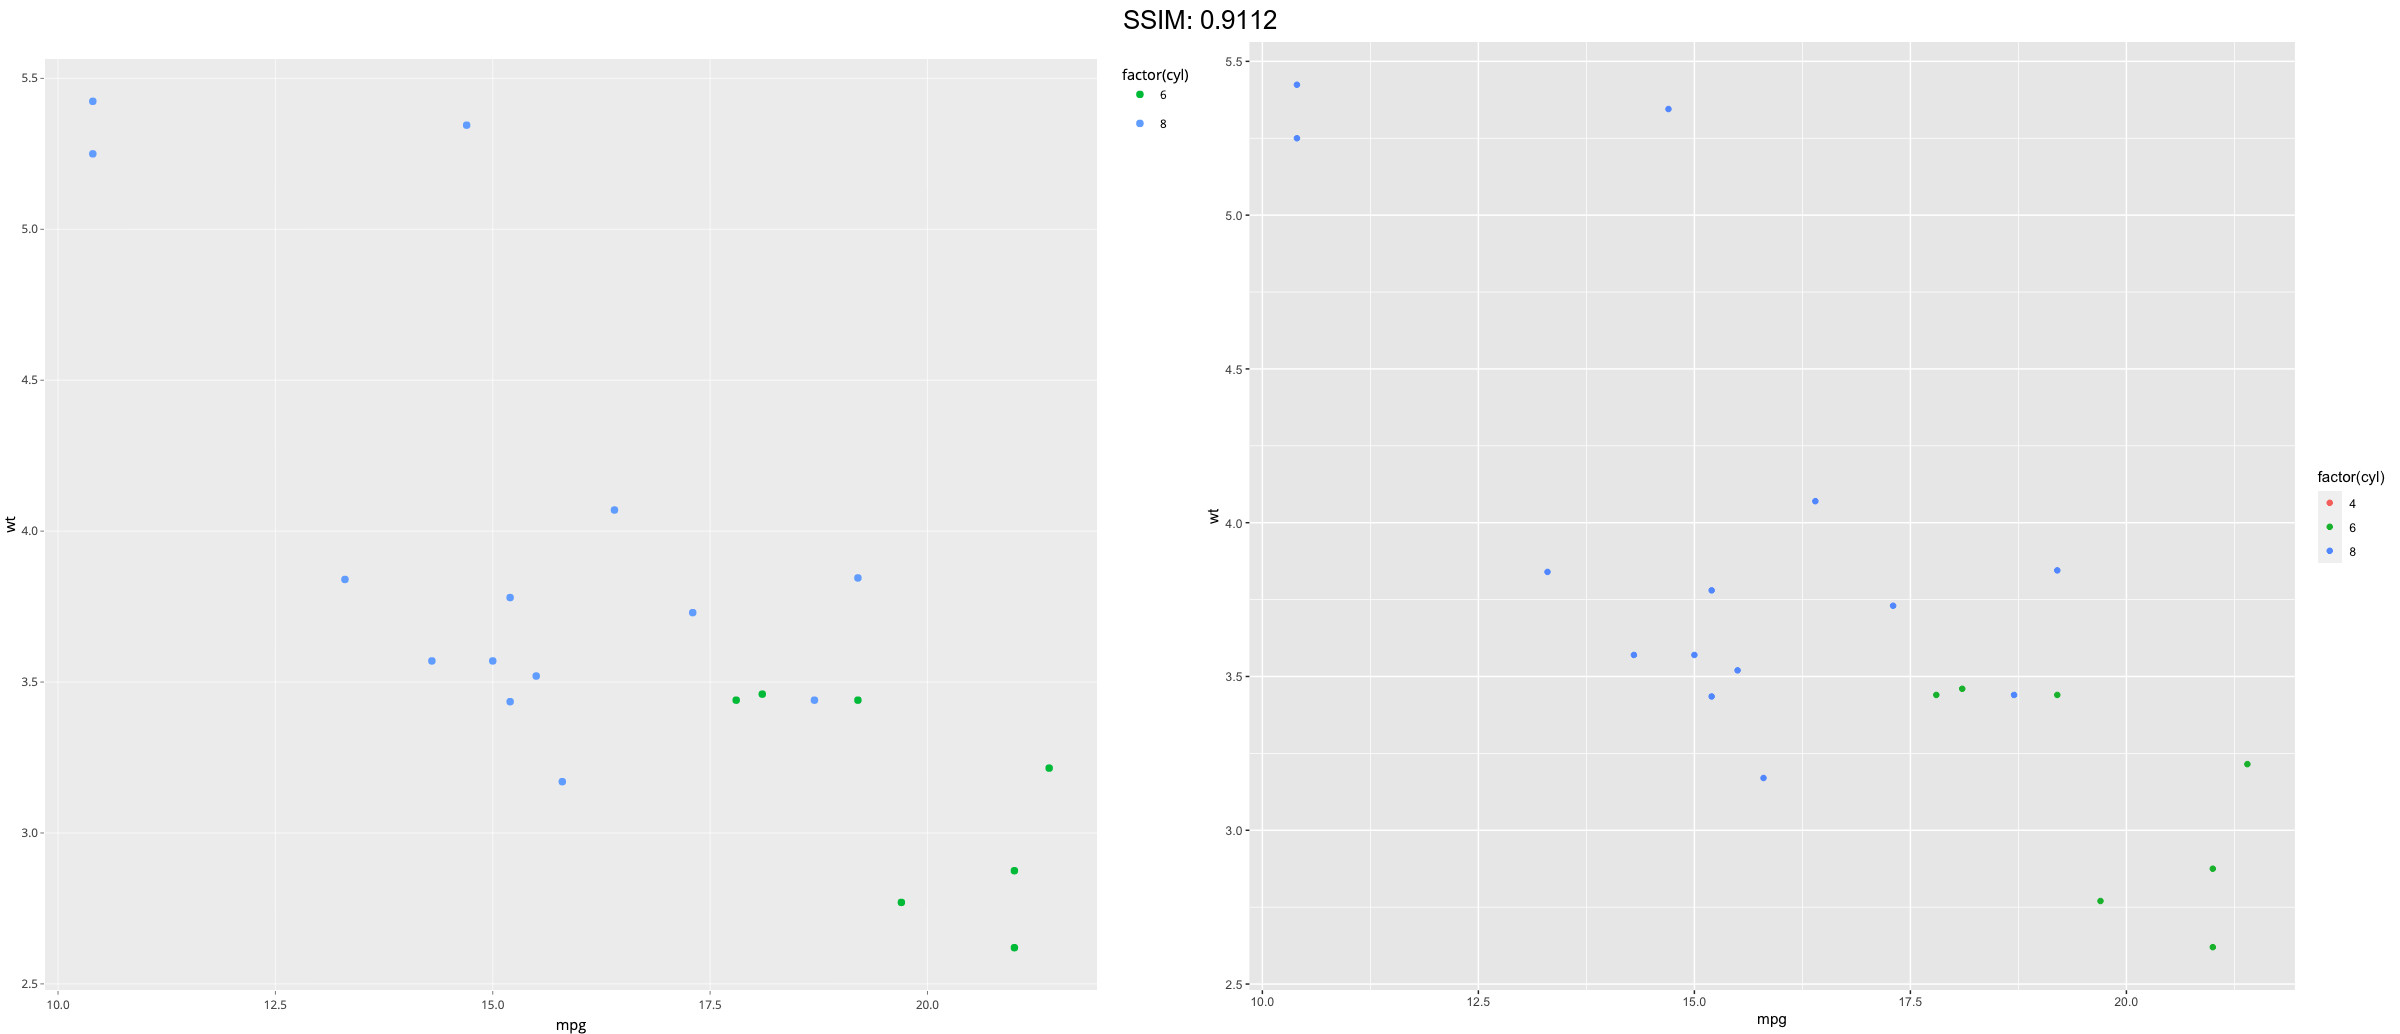
big <- subset(mtcars, cyl > 4)
p <-
ggplot(small, aes(mpg, wt, colour = factor(cyl))) +
geom_point() +
lims(colour = c("4", "6", "8"))
plotly::ggplotly(p)

small <- subset(mtcars, cyl == 4)
big <- subset(mtcars, cyl > 4)
p <-
 ggplot(big, aes(mpg, wt, colour = factor(cyl))) +
  geom_point() +
  lims(colour = c("4", "6", "8"))
plotly::ggplotly(p)

last_month <- Sys.Date() - 0:59
df <- data.frame(
  date = last_month,
  price = c(rnorm(30, mean = 15), runif(30) + 0.2 * (1:30))
)
p <- ggplot(df, aes(date, price)) +
  geom_line() +
  stat_smooth()
plotly::ggplotly(p)
## `geom_smooth()` using method = 'loess' and formula 'y ~ x'

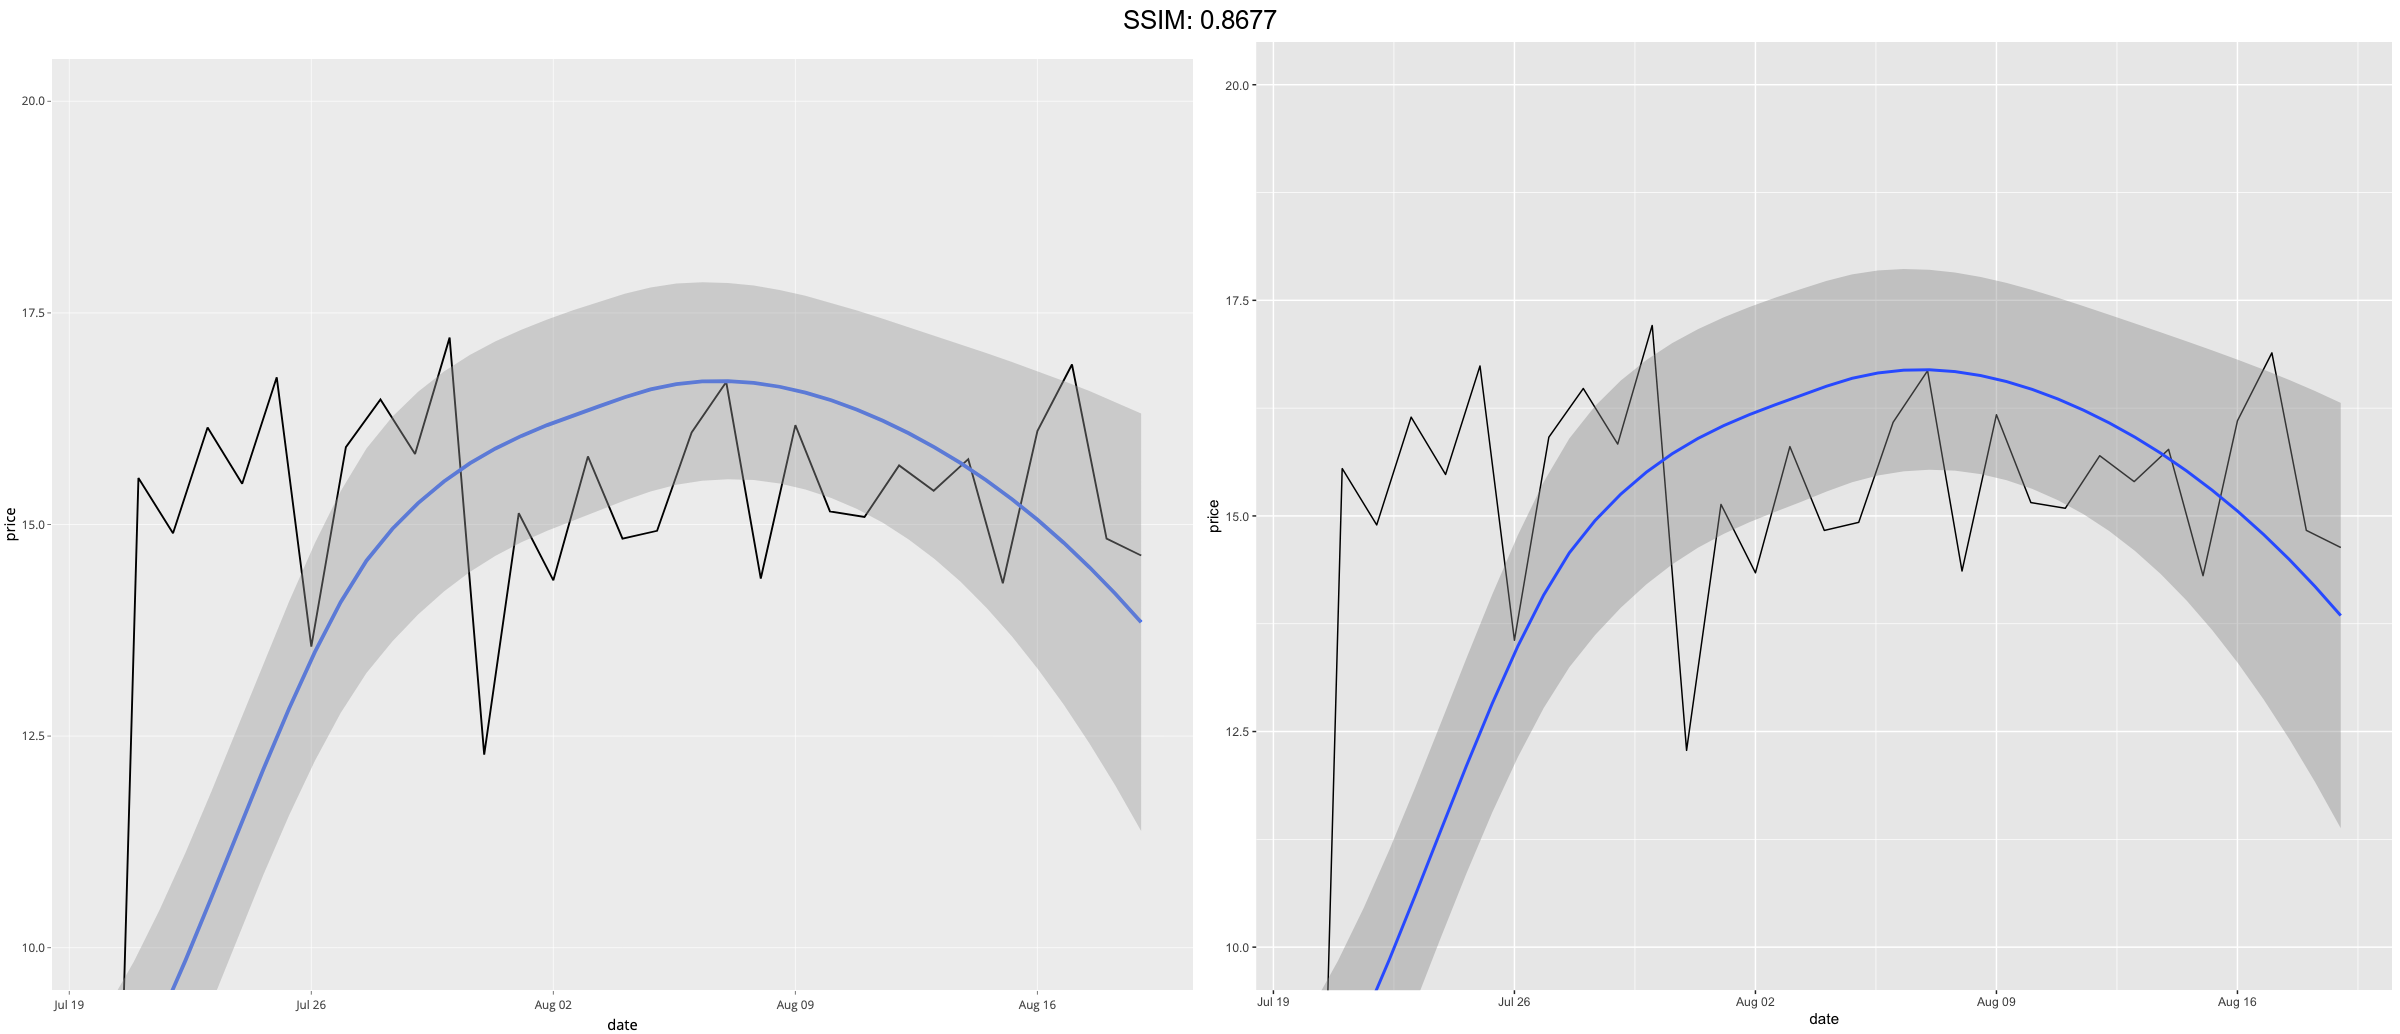
last_month <- Sys.Date() - 0:59
df <- data.frame(
  date = last_month,
  price = c(rnorm(30, mean = 15), runif(30) + 0.2 * (1:30))
)
p <- ggplot(df, aes(date, price)) +
  geom_line() +
  stat_smooth()
p <-  p + lims(x= c(Sys.Date() - 30, NA), y = c(10, 20))
plotly::ggplotly(p)
## `geom_smooth()` using method = 'loess' and formula 'y ~ x'
## Warning: Removed 30 rows containing non-finite values (stat_smooth).


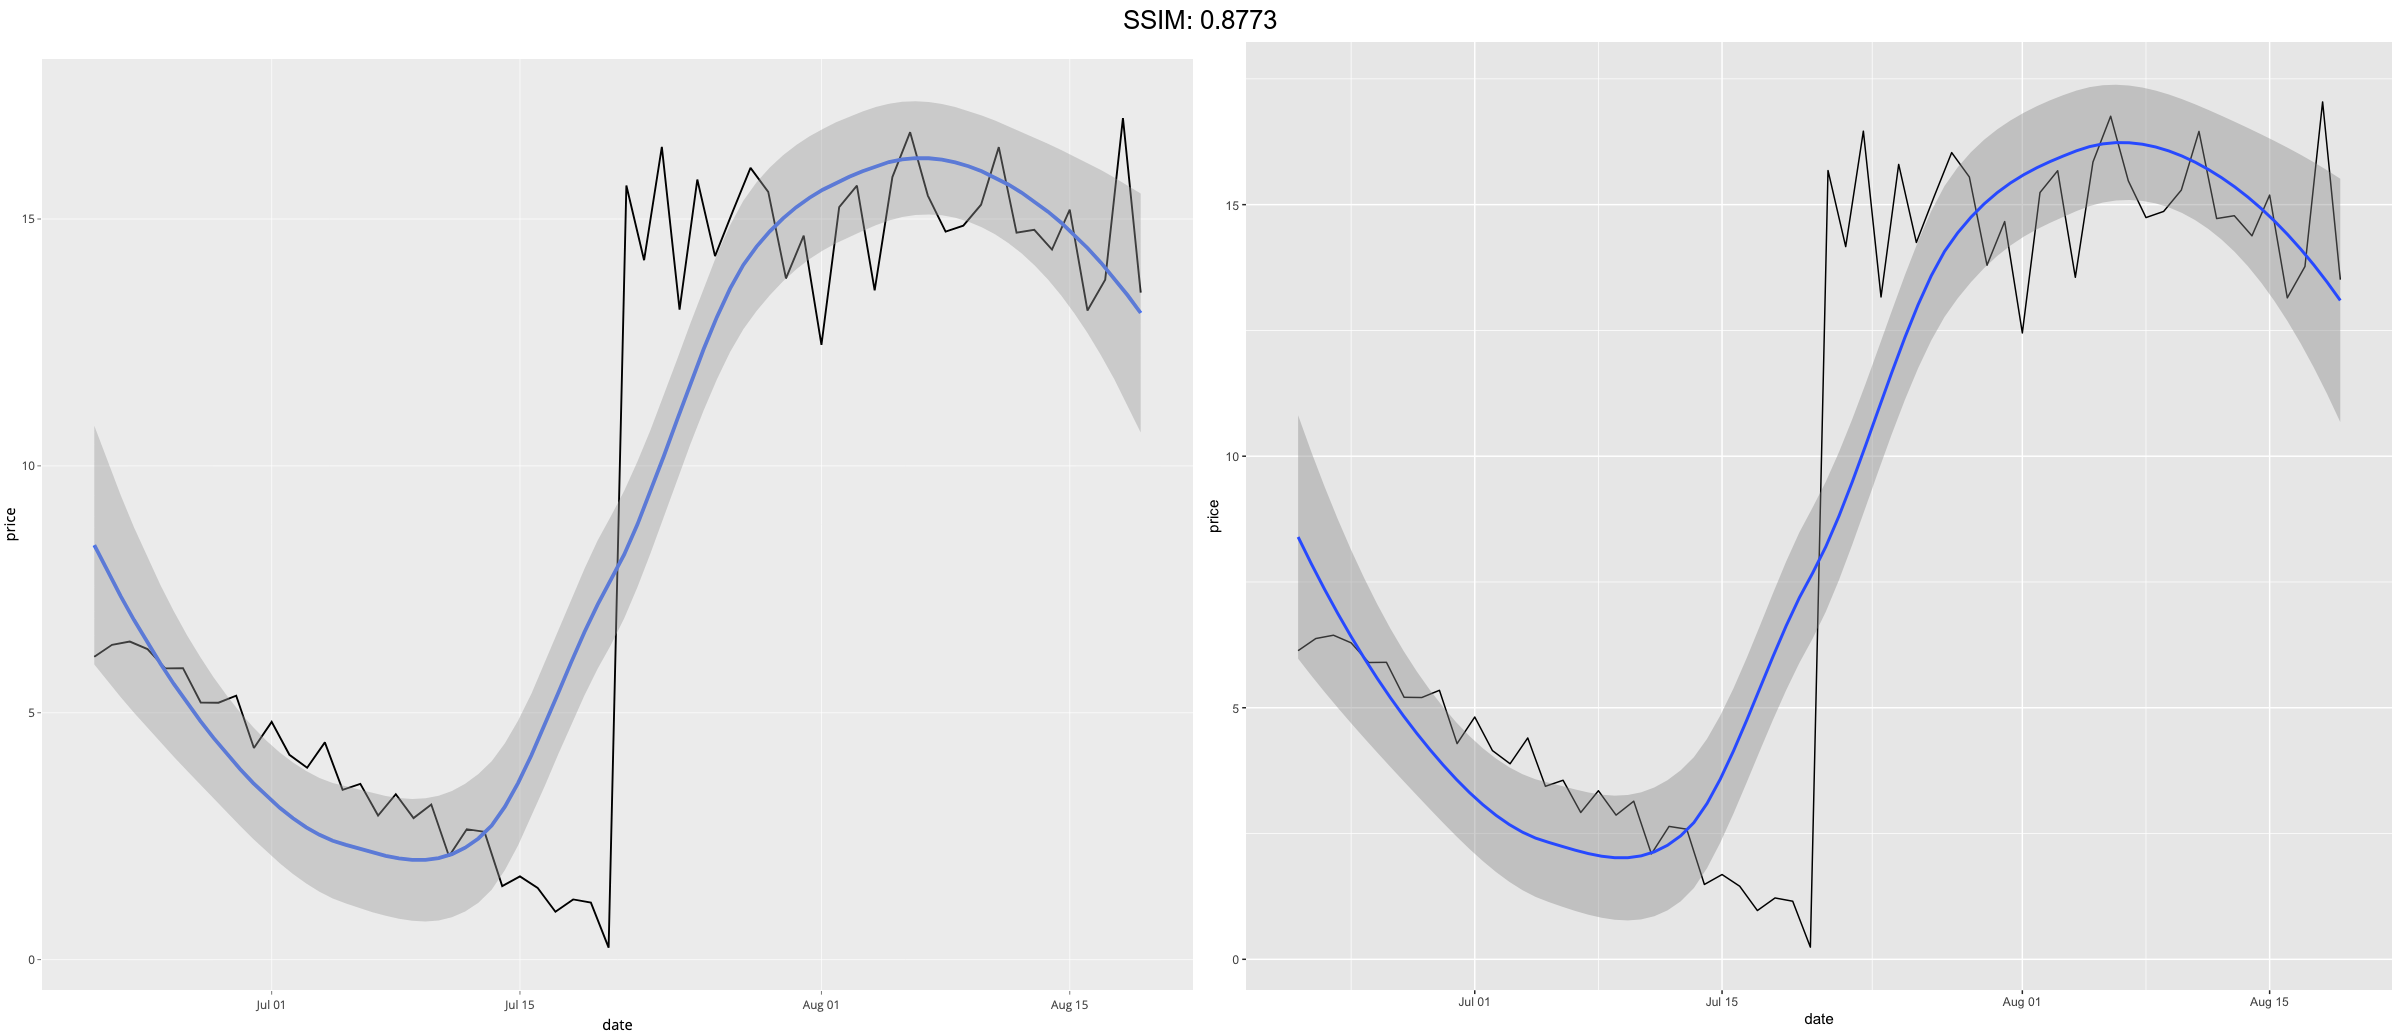
last_month <- Sys.Date() - 0:59
df <- data.frame(
  date = last_month,
  price = c(rnorm(30, mean = 15), runif(30) + 0.2 * (1:30))
)
p <- ggplot(df, aes(date, price)) +
  geom_line() +
  stat_smooth()
p <-  p + coord_cartesian(xlim =c(Sys.Date() - 30, NA), ylim = c(10, 20))
plotly::ggplotly(p)
## `geom_smooth()` using method = 'loess' and formula 'y ~ x'