GGPLOT - guides
Set guides for each scale and then convert them with ggplotly.
dat <- data.frame(x = 1:5, y = 1:5, p = 1:5, q = factor(1:5),
 r = factor(1:5))
p <-
  ggplot(dat, aes(x, y, colour = p, size = q, shape = r)) +
  geom_point()
plotly::ggplotly(p)
## Warning: Using size for a discrete variable is not advised.


dat <- data.frame(x = 1:5, y = 1:5, p = 1:5, q = factor(1:5),
 r = factor(1:5))
p <-
  ggplot(dat, aes(x, y, colour = p, size = q, shape = r)) +
  geom_point()
p <-  p + guides(colour = "colorbar", size = "legend", shape = "legend")
plotly::ggplotly(p)
## Warning: Using size for a discrete variable is not advised.


dat <- data.frame(x = 1:5, y = 1:5, p = 1:5, q = factor(1:5),
 r = factor(1:5))
p <-
  ggplot(dat, aes(x, y, colour = p, size = q, shape = r)) +
  geom_point()
p <-
 p + guides(colour = guide_colorbar(), size = guide_legend(),
  shape = guide_legend())
plotly::ggplotly(p)
## Warning: Using size for a discrete variable is not advised.


dat <- data.frame(x = 1:5, y = 1:5, p = 1:5, q = factor(1:5),
 r = factor(1:5))
p <-
  ggplot(dat, aes(x, y, colour = p, size = q, shape = r)) +
  geom_point()
p <-
 p +
 scale_colour_continuous(guide = "colorbar") +
 scale_size_discrete(guide = "legend") +
 scale_shape(guide = "legend")
plotly::ggplotly(p)


dat <- data.frame(x = 1:5, y = 1:5, p = 1:5, q = factor(1:5),
 r = factor(1:5))
p <-
  ggplot(dat, aes(x, y, colour = p, size = q, shape = r)) +
  geom_point()
p <-   p + guides(colour = "none")
plotly::ggplotly(p)
## Warning: Using size for a discrete variable is not advised.


dat <- data.frame(x = 1:5, y = 1:5, p = 1:5, q = factor(1:5),
 r = factor(1:5))
p <-
  ggplot(dat, aes(x, y, colour = p, size = q, shape = r)) +
  geom_point()
p <-   p + guides(colour = "colorbar",size = "none")
plotly::ggplotly(p)
## Warning: Using size for a discrete variable is not advised.


dat <- data.frame(x = 1:5, y = 1:5, p = 1:5, q = factor(1:5),
 r = factor(1:5))
p <-
  ggplot(dat, aes(x, y, colour = p, size = q, shape = r)) +
  geom_point()
p <-
 p +
  guides(
    colour = guide_legend("title"),
    size = guide_legend("title"),
    shape = guide_legend("title")
 )
plotly::ggplotly(p)
## Warning: Using size for a discrete variable is not advised.


dat <- data.frame(x = 1:5, y = 1:5, p = 1:5, q = factor(1:5),
 r = factor(1:5))
p <-
  ggplot(dat, aes(x, y, colour = p, size = q, shape = r)) +
  geom_point()
g <- guide_legend("title")
p <-  p + guides(colour = g, size = g, shape = g)
plotly::ggplotly(p)
## Warning: Using size for a discrete variable is not advised.


dat <- data.frame(x = 1:5, y = 1:5, p = 1:5, q = factor(1:5),
 r = factor(1:5))
p <-
  ggplot(dat, aes(x, y, colour = p, size = q, shape = r)) +
  geom_point()
g <- guide_legend("title")
p <-  p + theme(legend.position = "bottom")
plotly::ggplotly(p)
## Warning: Using size for a discrete variable is not advised.


dat <- data.frame(x = 1:5, y = 1:5, p = 1:5, q = factor(1:5),
r = factor(1:5))
p <-
ggplot(dat, aes(x, y, colour = p, size = q, shape = r)) +
geom_point()
g <- guide_legend("title")
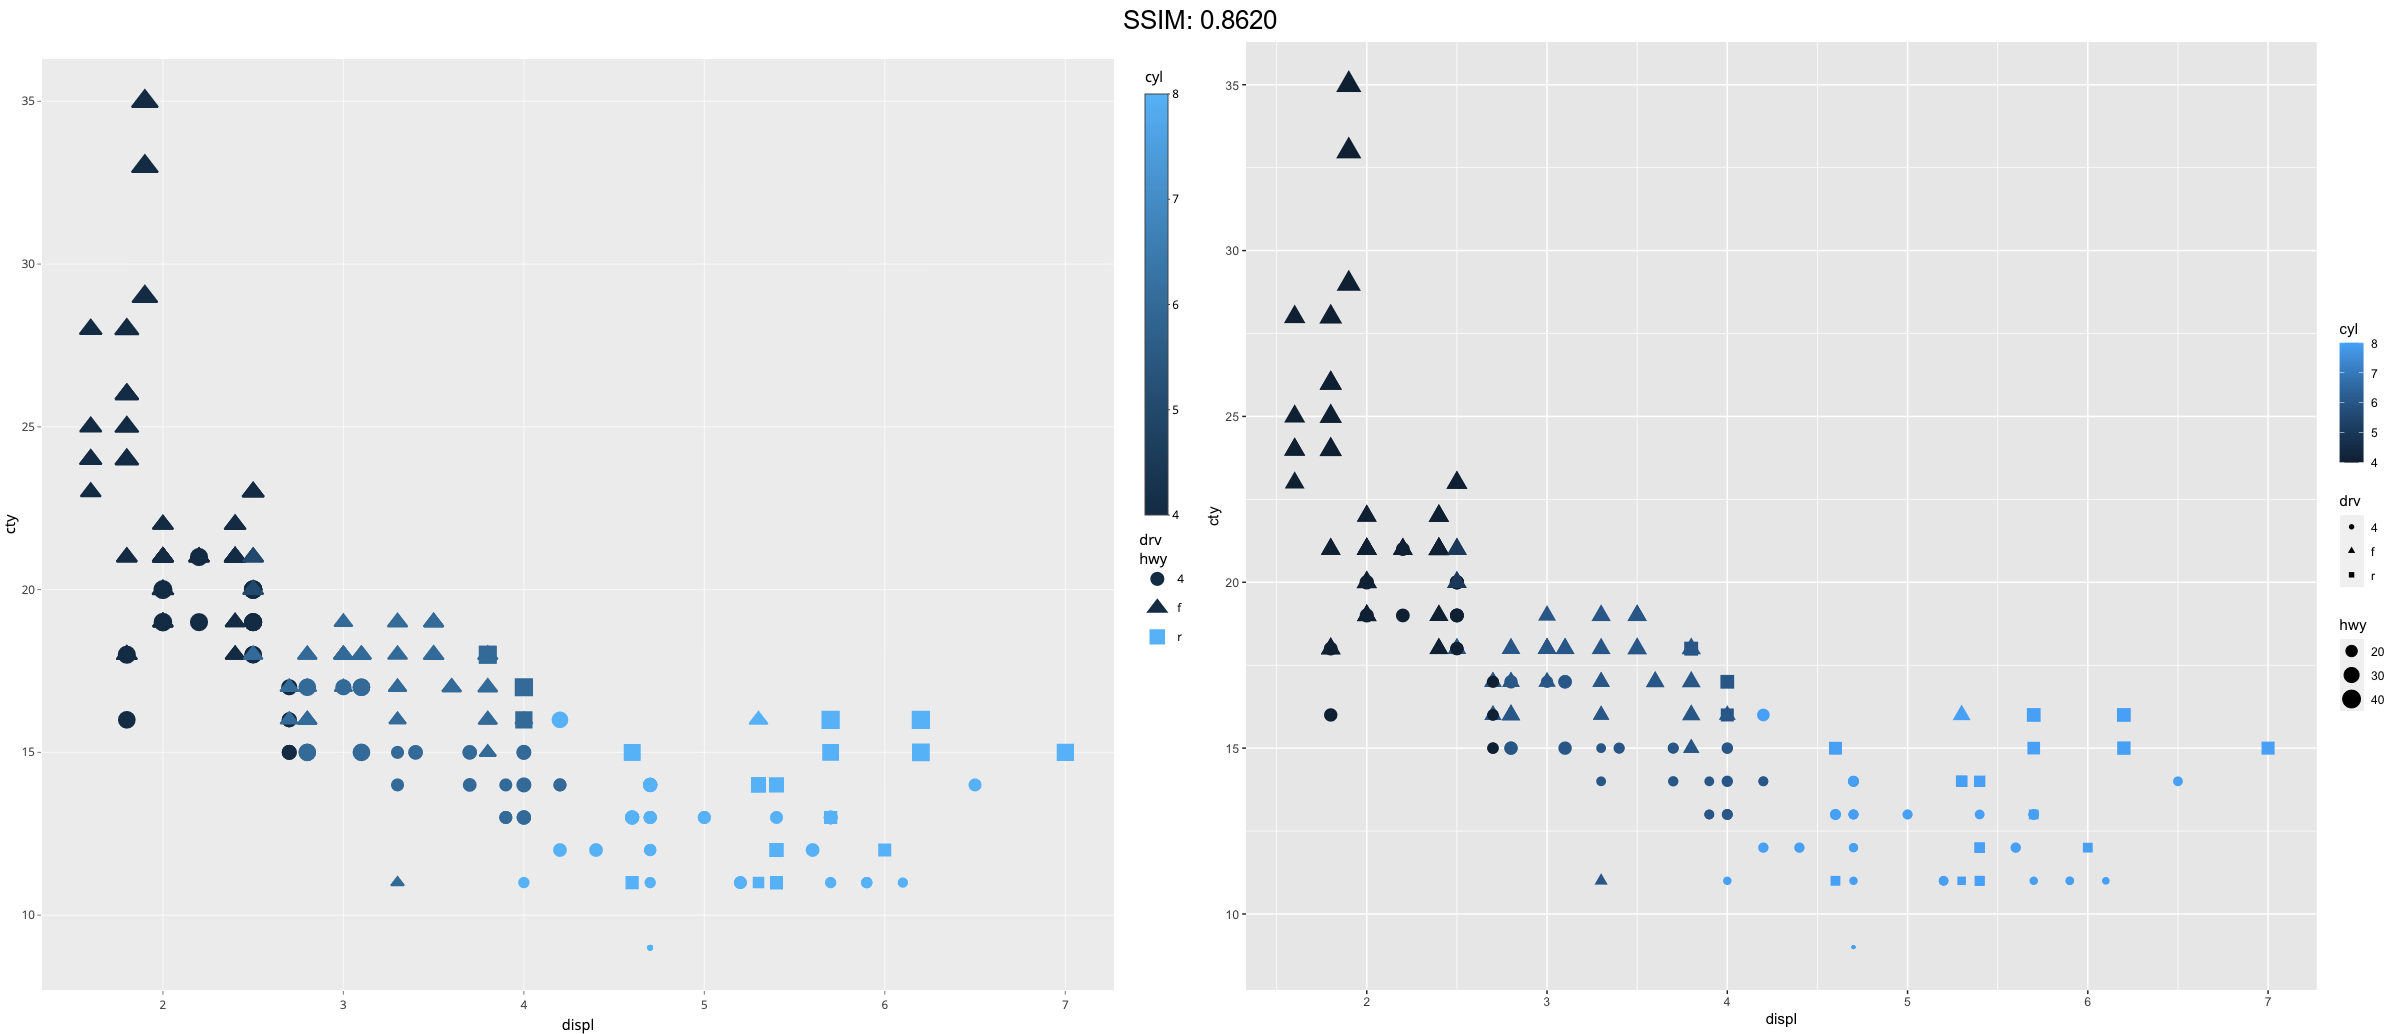
p <-
ggplot(mpg, aes(displ, cty)) +
geom_point(aes(size = hwy, colour = cyl, shape = drv)) +
guides(
colour = guide_colourbar(order = 1),
shape = guide_legend(order = 2),
size = guide_legend(order = 3)
)
plotly::ggplotly(p)