GGPLOT - guide_coloursteps
It shows areas between breaks as a single constant colour instead of the gradient known from the colourbar counterpart and then convert them with ggplotly.
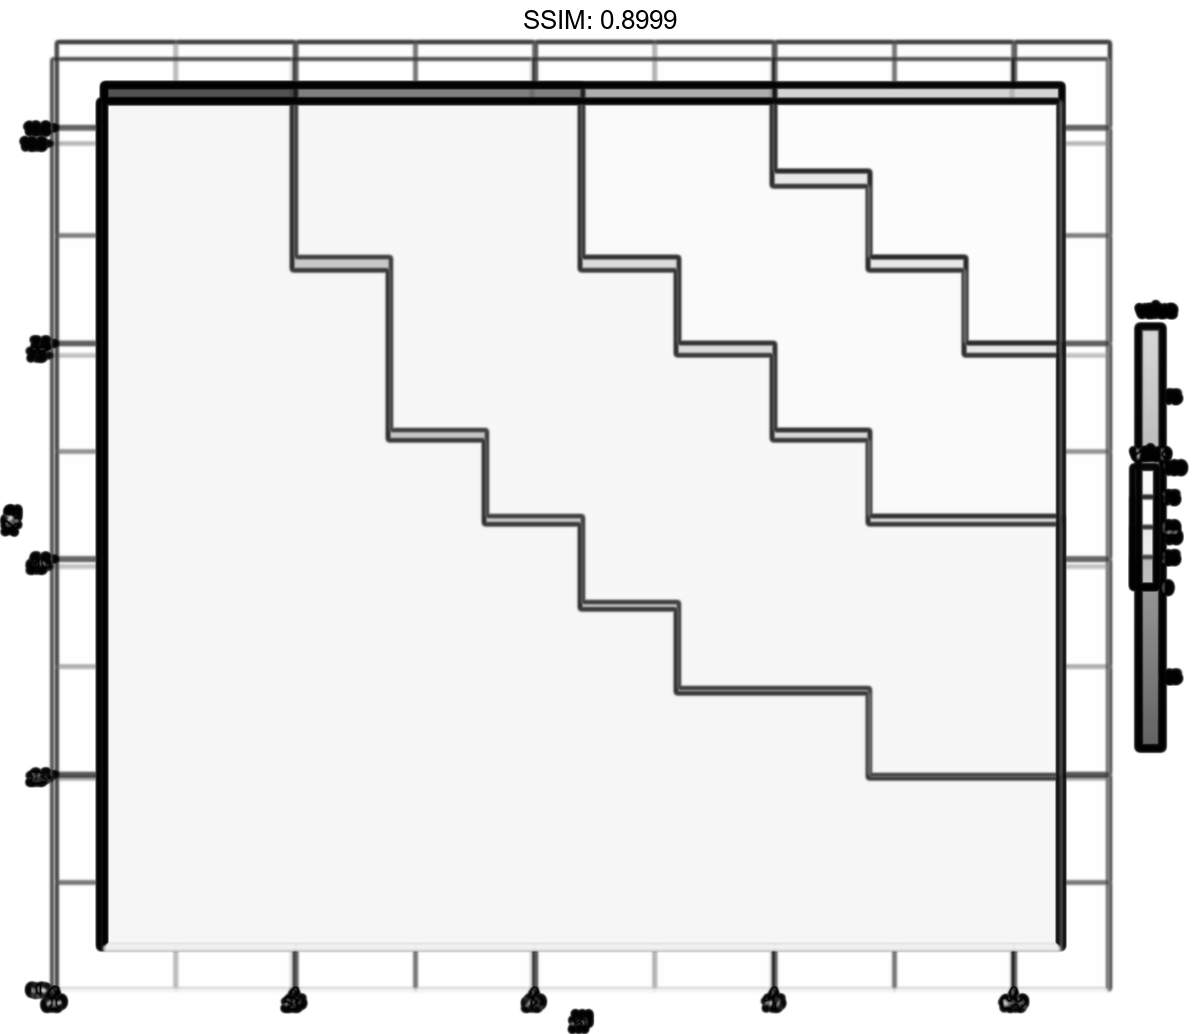
df <- expand.grid(X1 = 1:10, X2 = 1:10)
df$value <- df$X1 * df$X2
p <- ggplot(df, aes(X1, X2)) + geom_tile(aes(fill = value))
p <-  p + scale_fill_binned()
plotly::ggplotly(p)

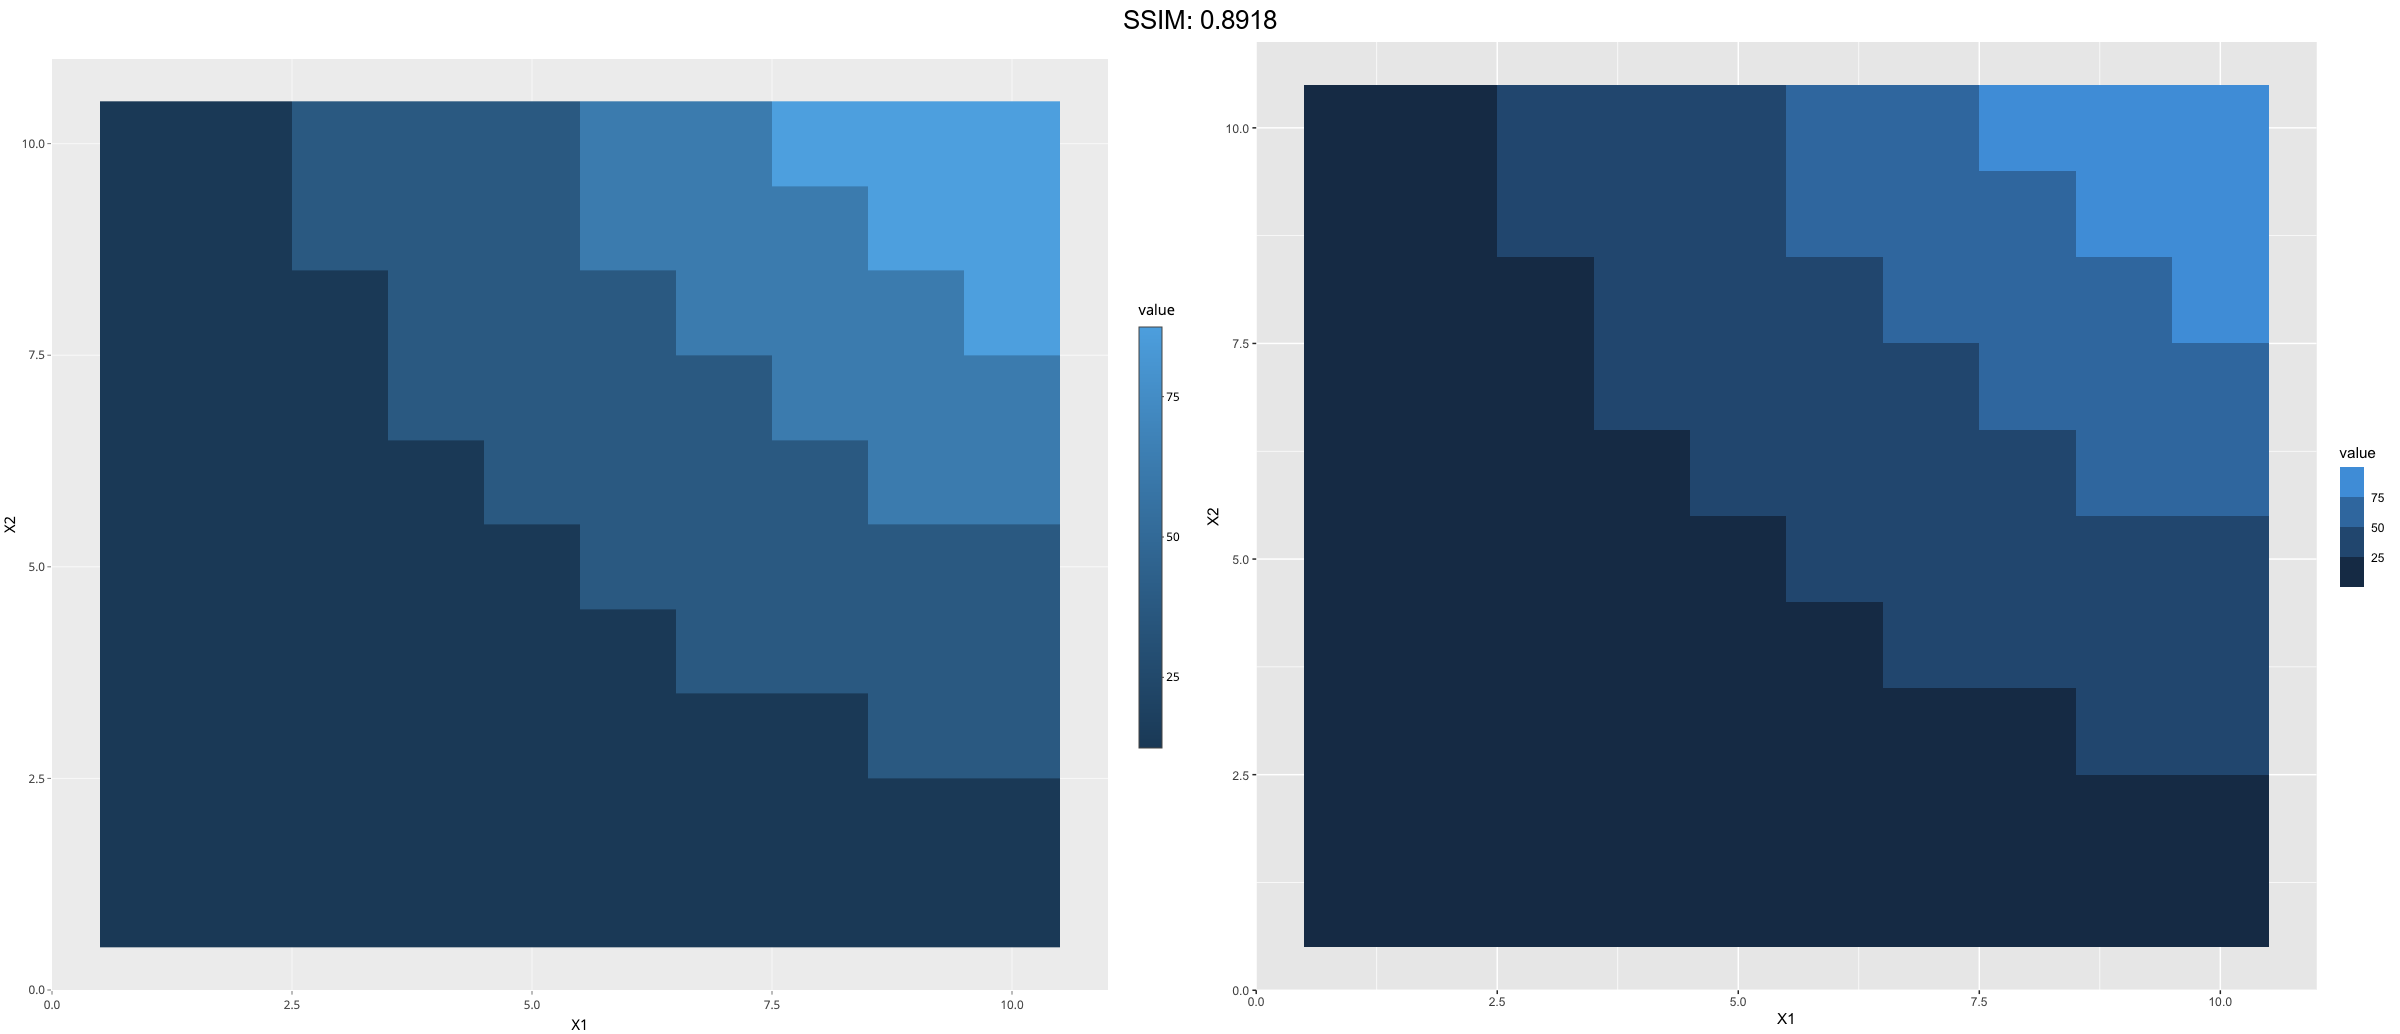
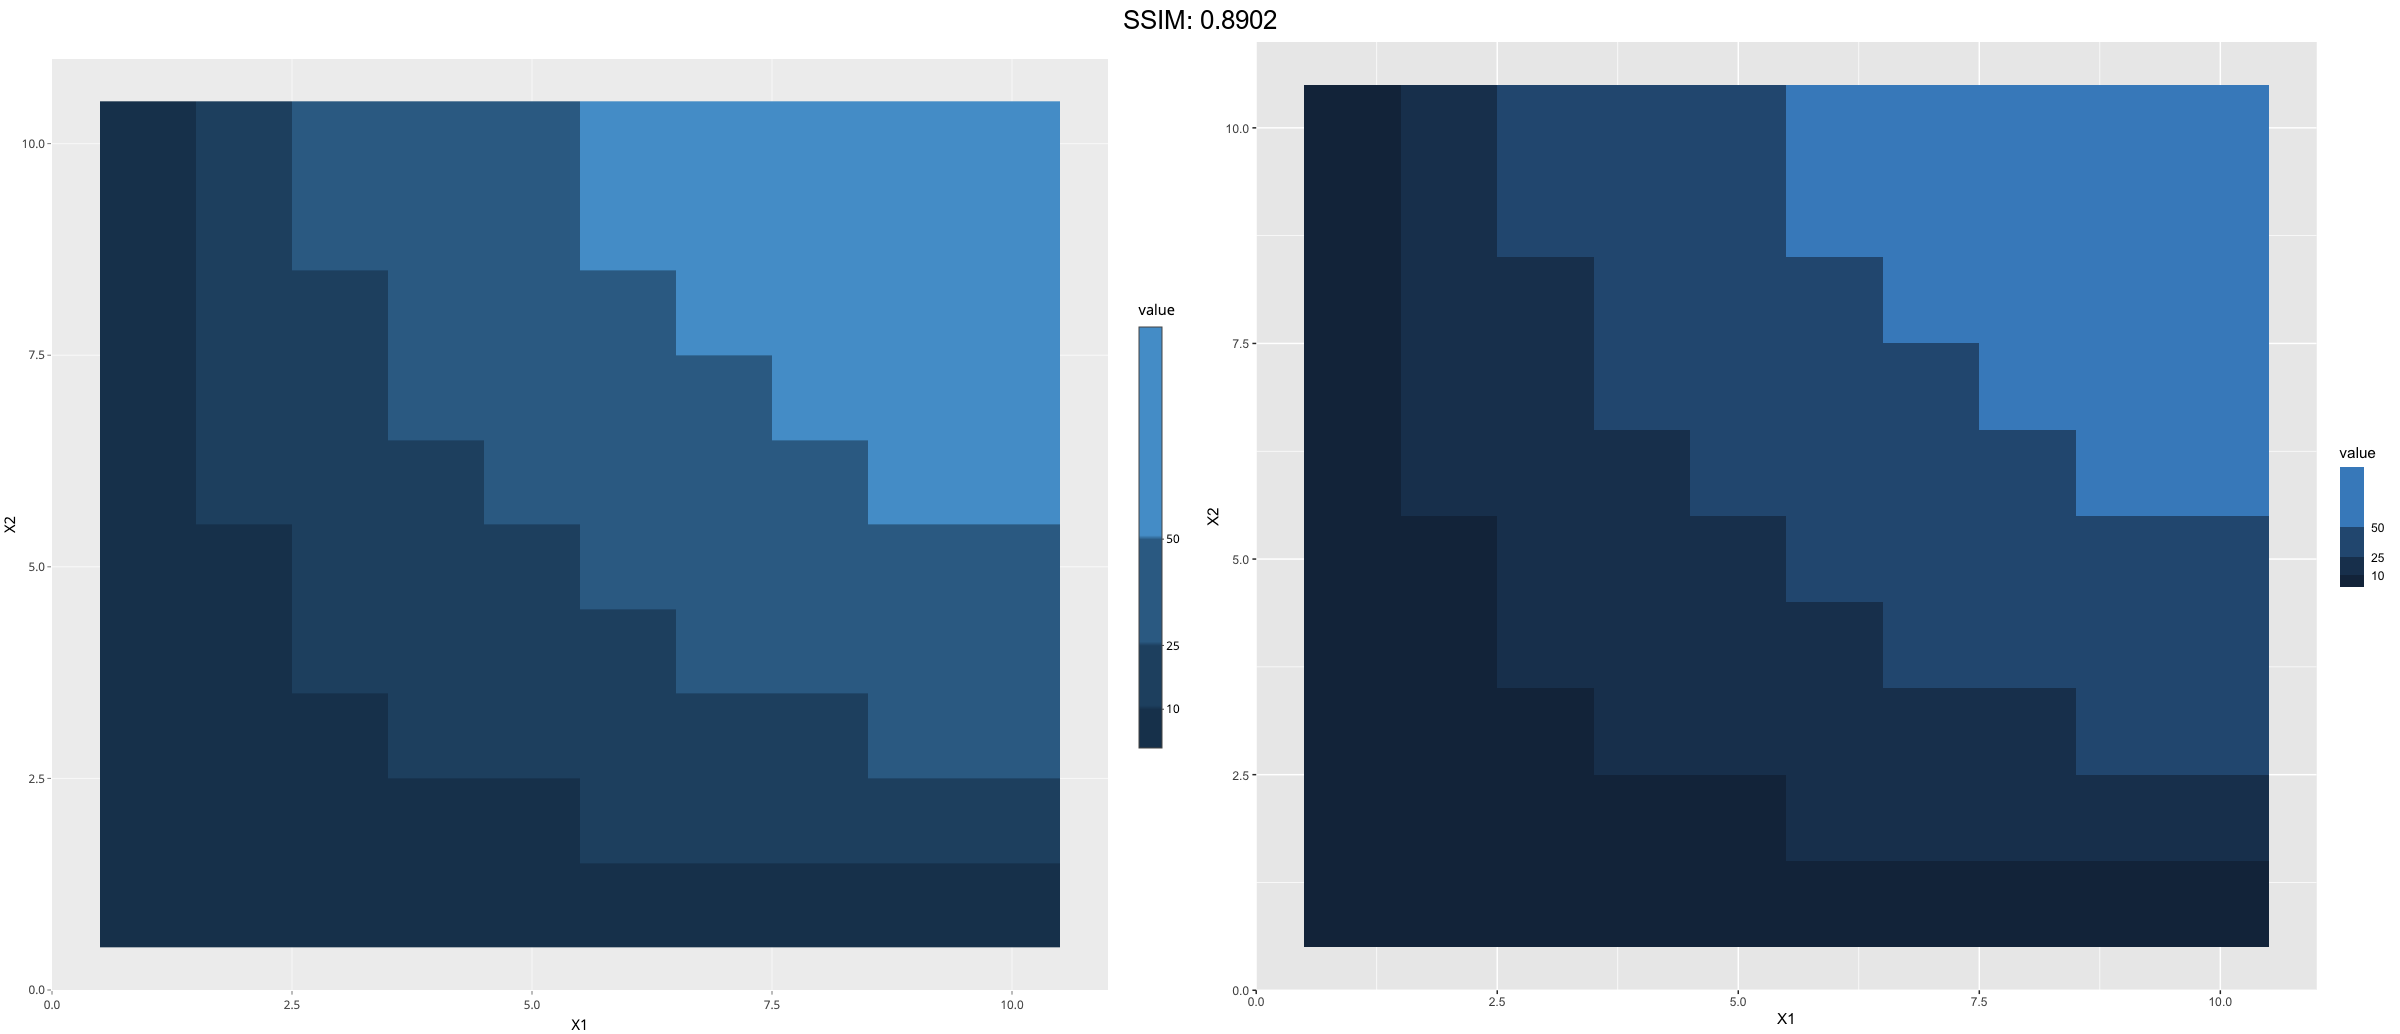
df <- expand.grid(X1 = 1:10, X2 = 1:10)
df$value <- df$X1 * df$X2
p <- ggplot(df, aes(X1, X2)) + geom_tile(aes(fill = value))
p <-  p + scale_fill_binned(breaks = c(10, 25, 50))
plotly::ggplotly(p)
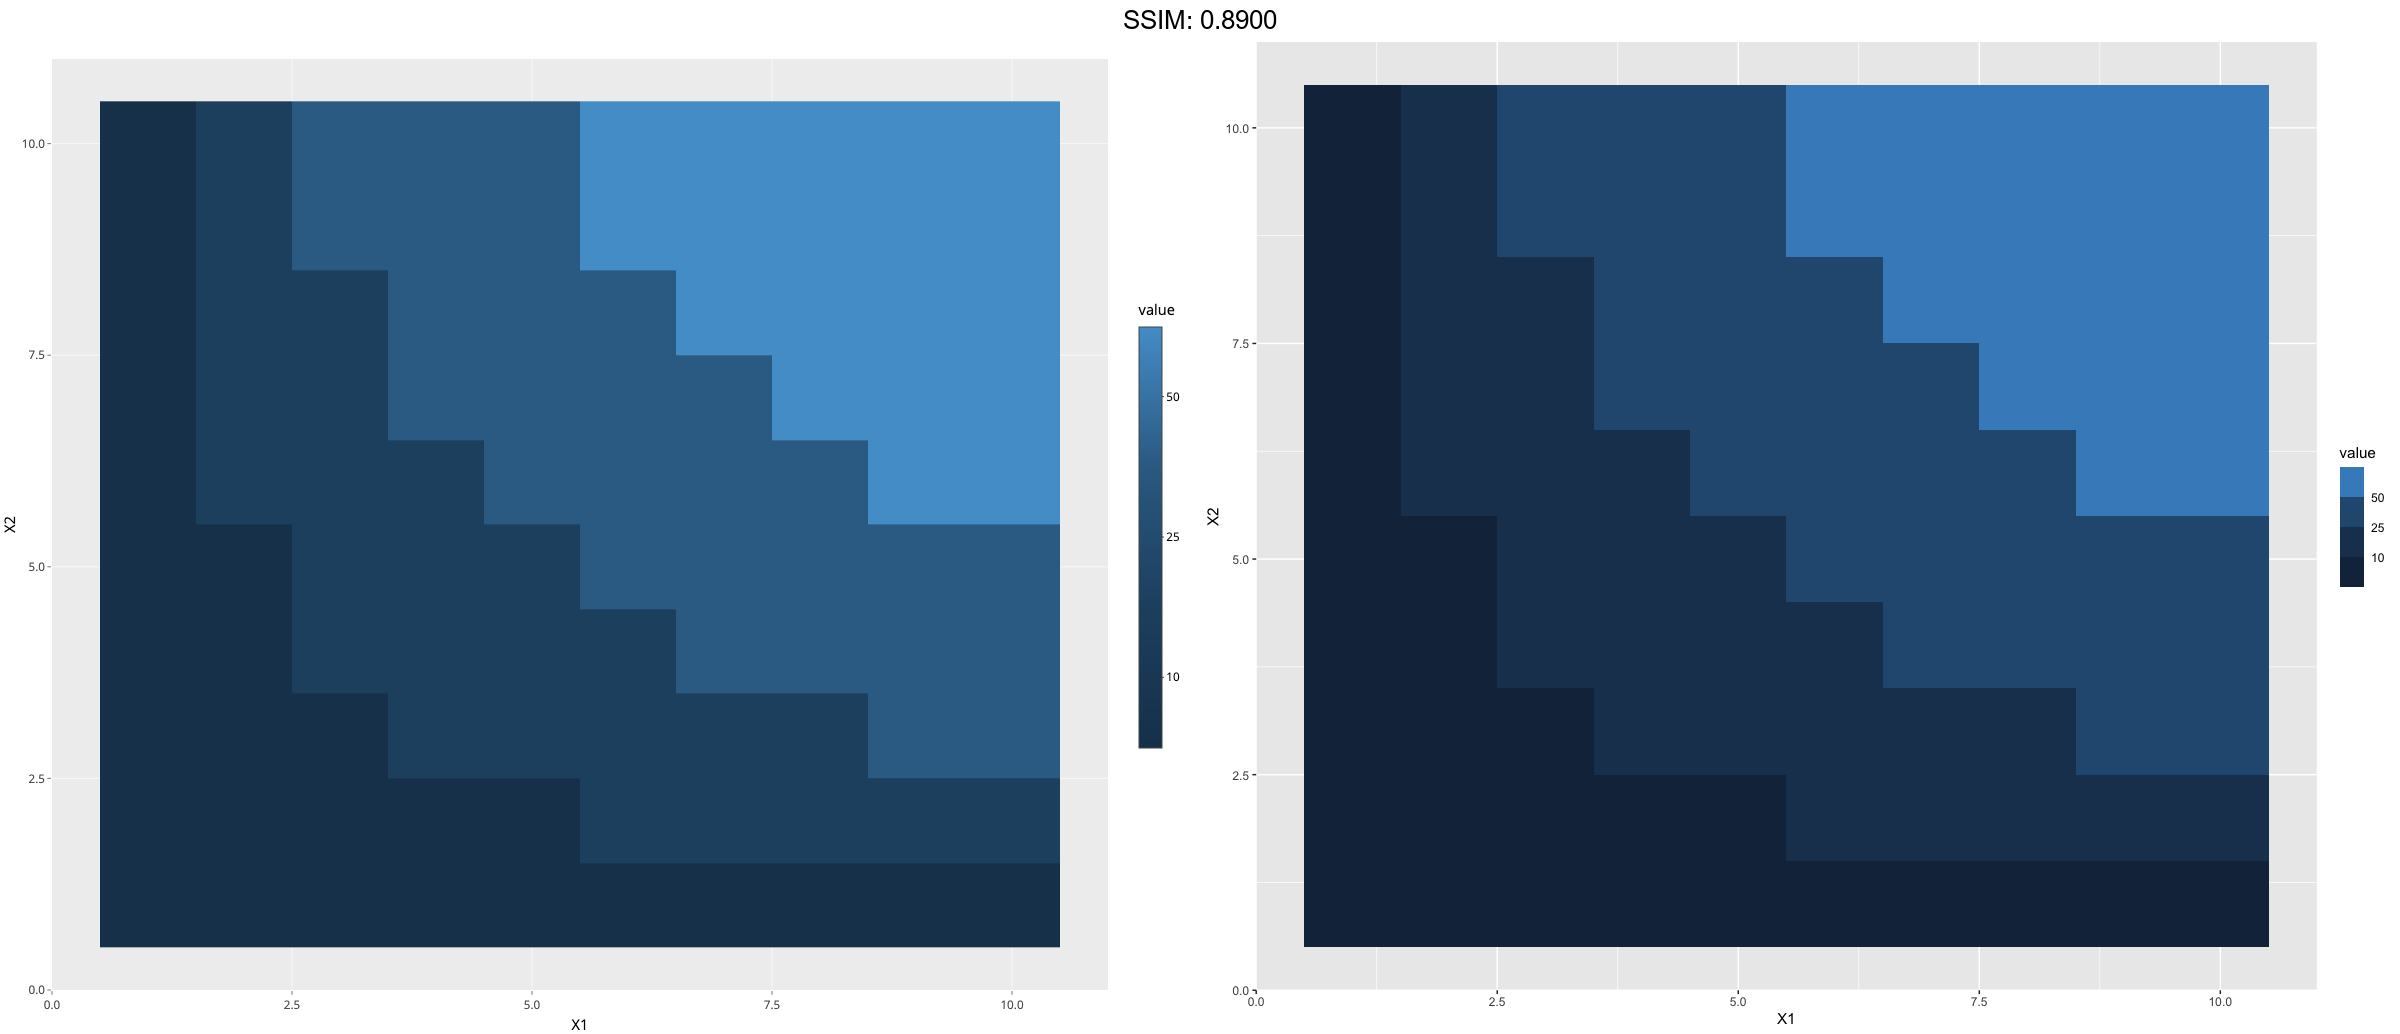
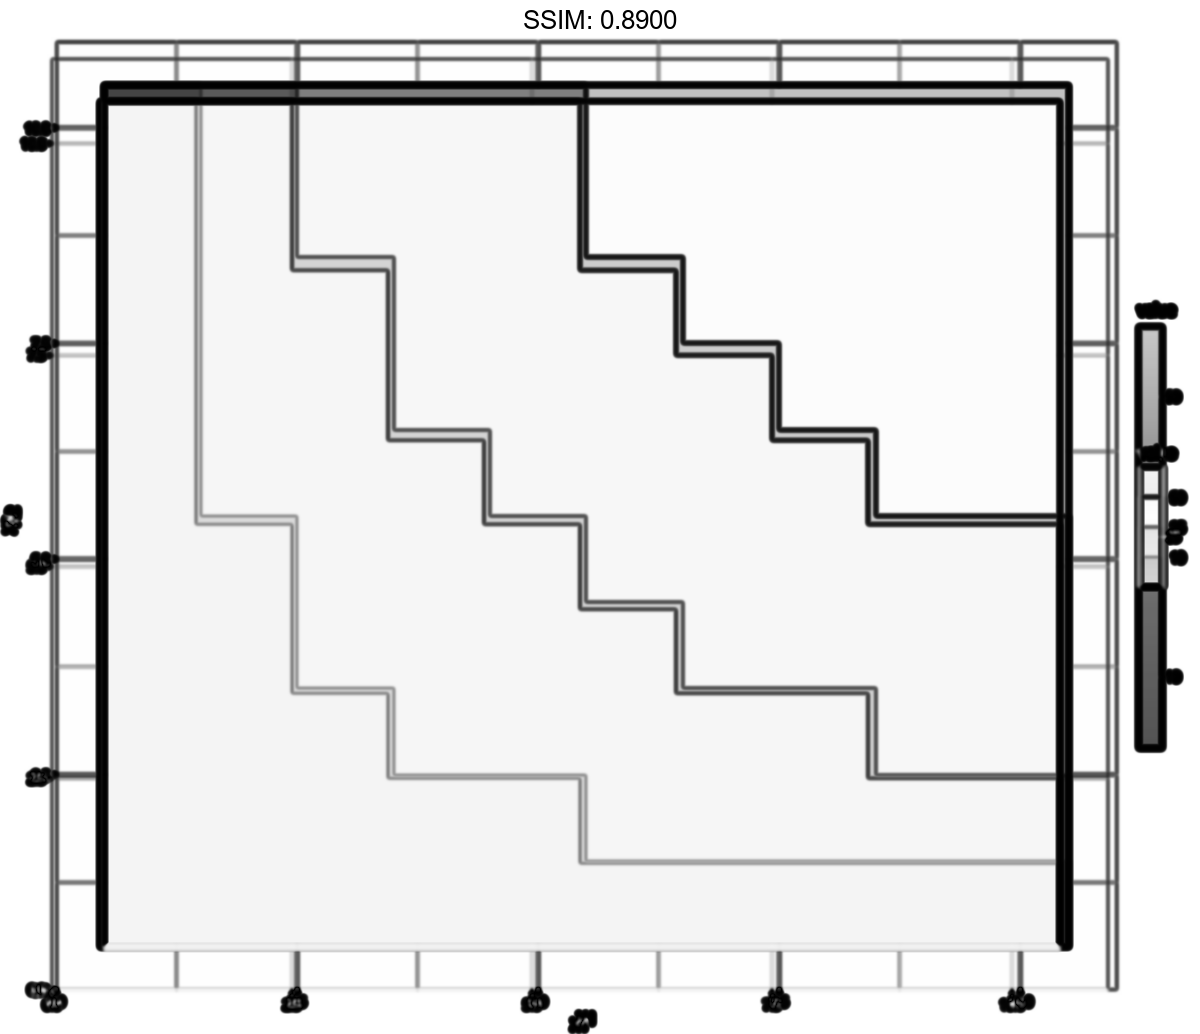
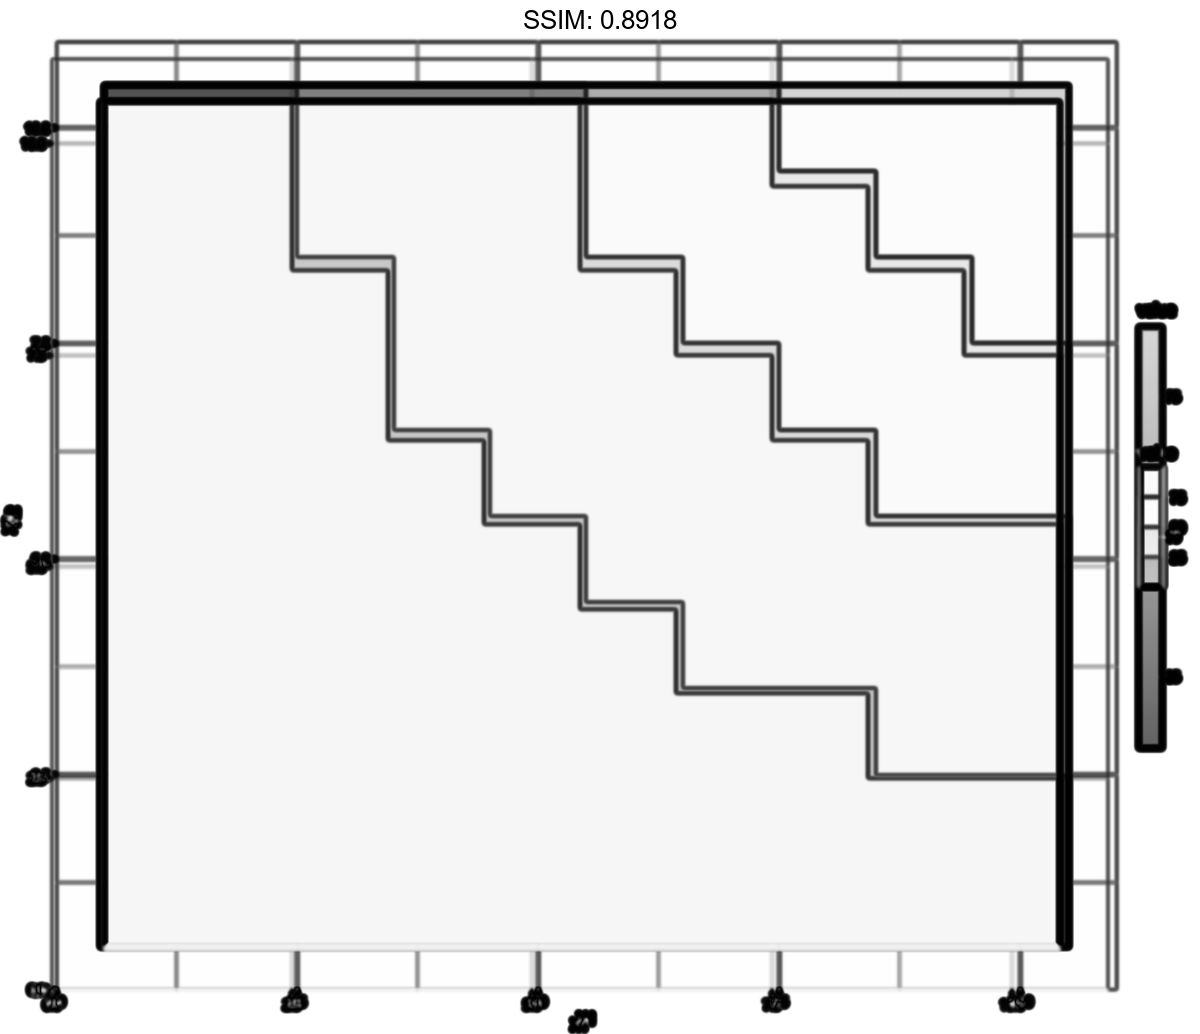
df <- expand.grid(X1 = 1:10, X2 = 1:10)
df$value <- df$X1 * df$X2
p <- ggplot(df, aes(X1, X2)) + geom_tile(aes(fill = value))
p <-
 p + scale_fill_binned(
  breaks = c(10, 25, 50),
  guide = guide_coloursteps(even.steps = FALSE)
)
plotly::ggplotly(p)
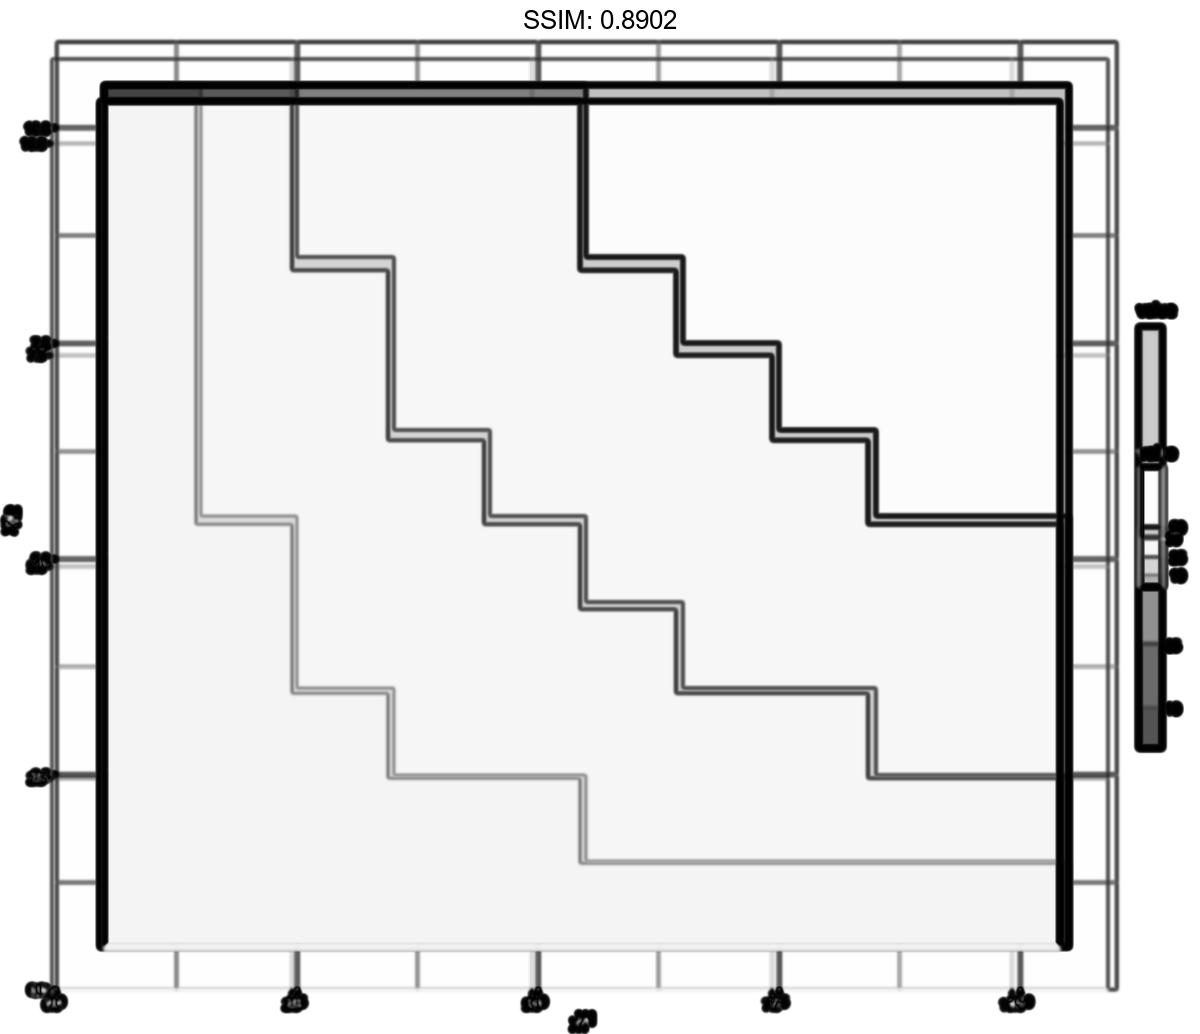
df <- expand.grid(X1 = 1:10, X2 = 1:10)
df$value <- df$X1 * df$X2
p <- ggplot(df, aes(X1, X2)) + geom_tile(aes(fill = value))
p <-  p + scale_fill_binned(guide = guide_coloursteps(show.limits = TRUE))
plotly::ggplotly(p)
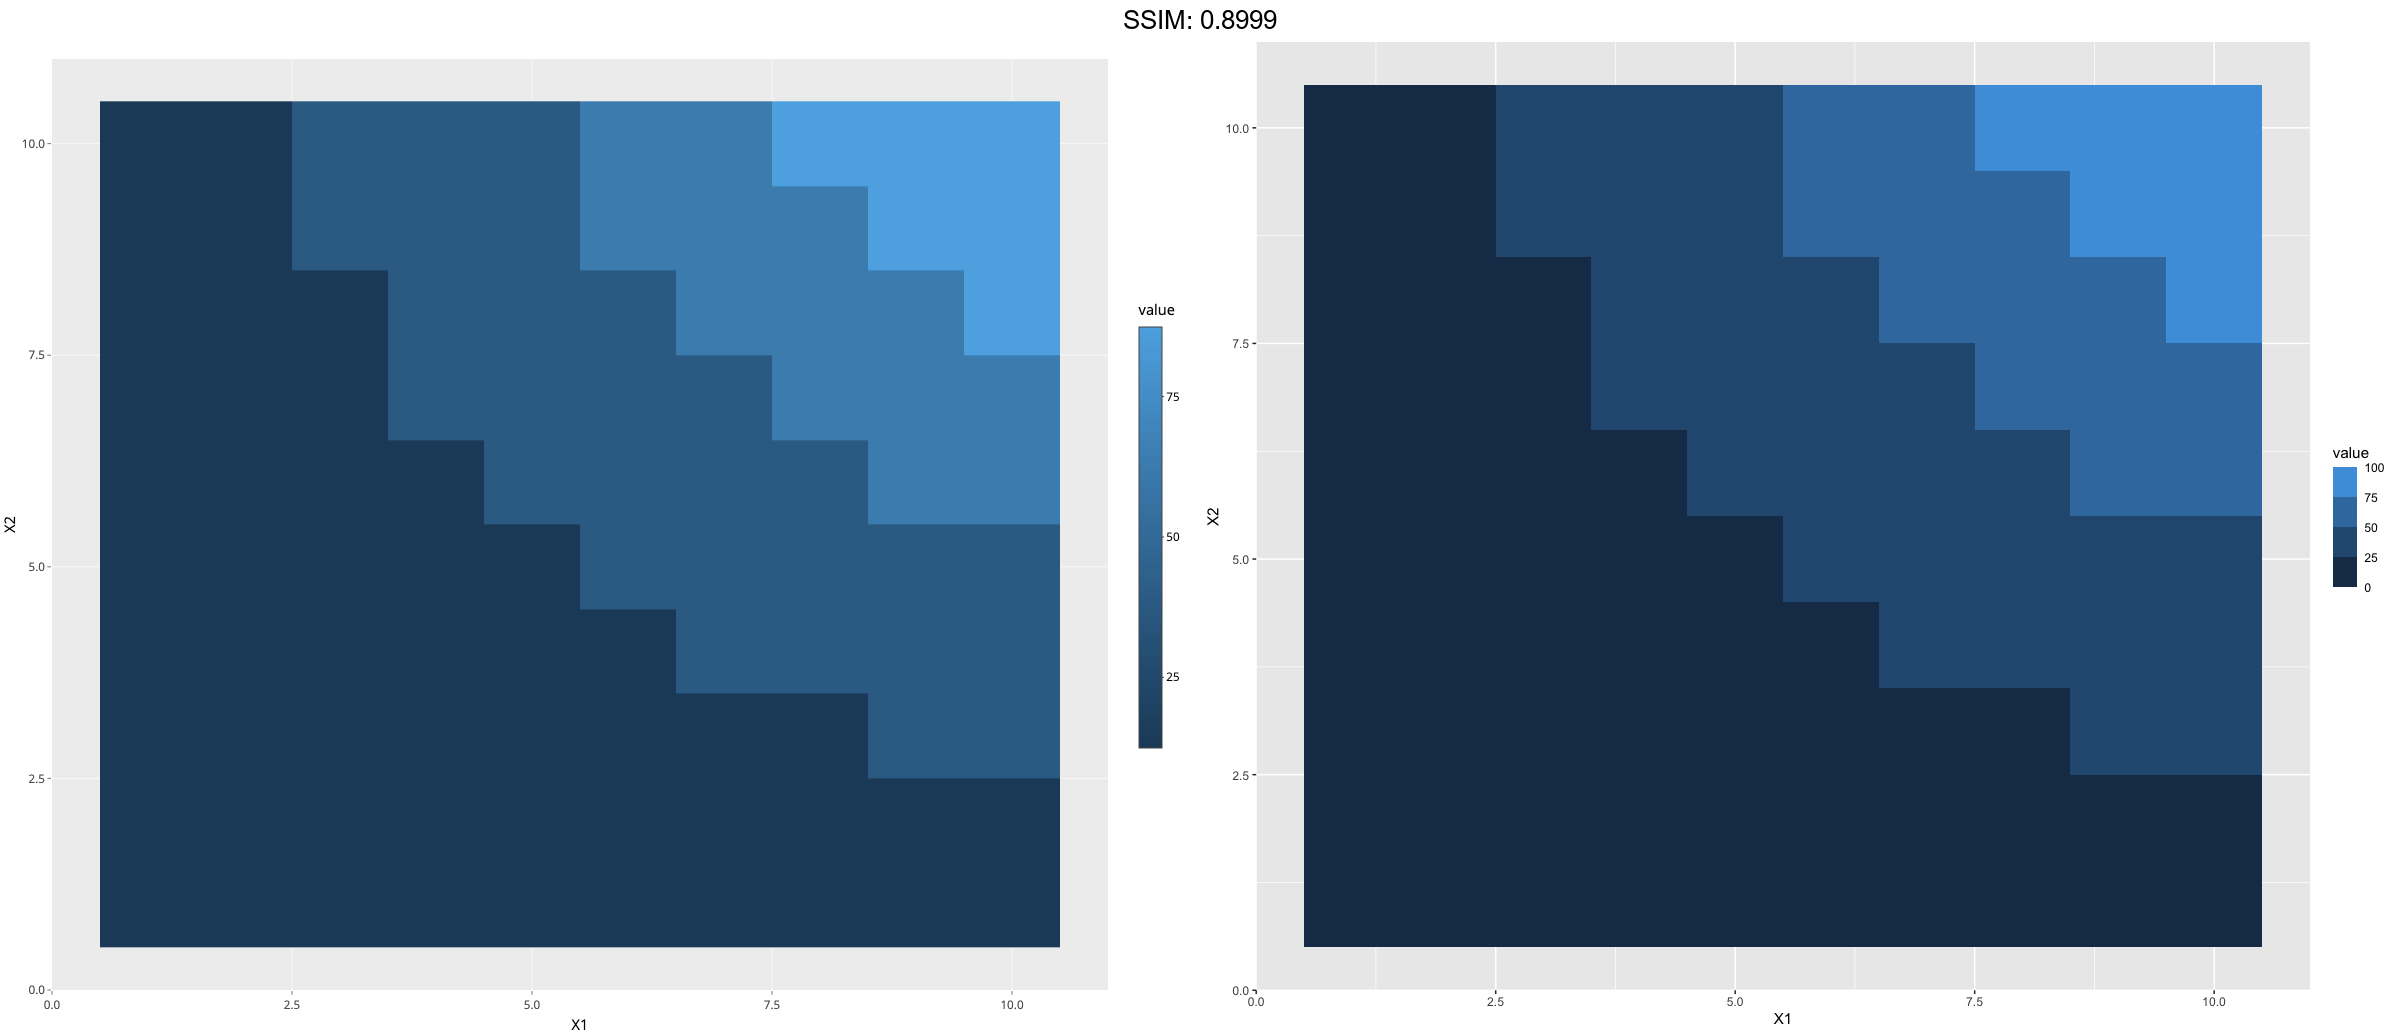

df <- expand.grid(X1 = 1:10, X2 = 1:10)
df$value <- df$X1 * df$X2
p <- ggplot(df, aes(X1, X2)) + geom_tile(aes(fill = value))
p <-  p + scale_fill_binned(show.limits = TRUE)
plotly::ggplotly(p)