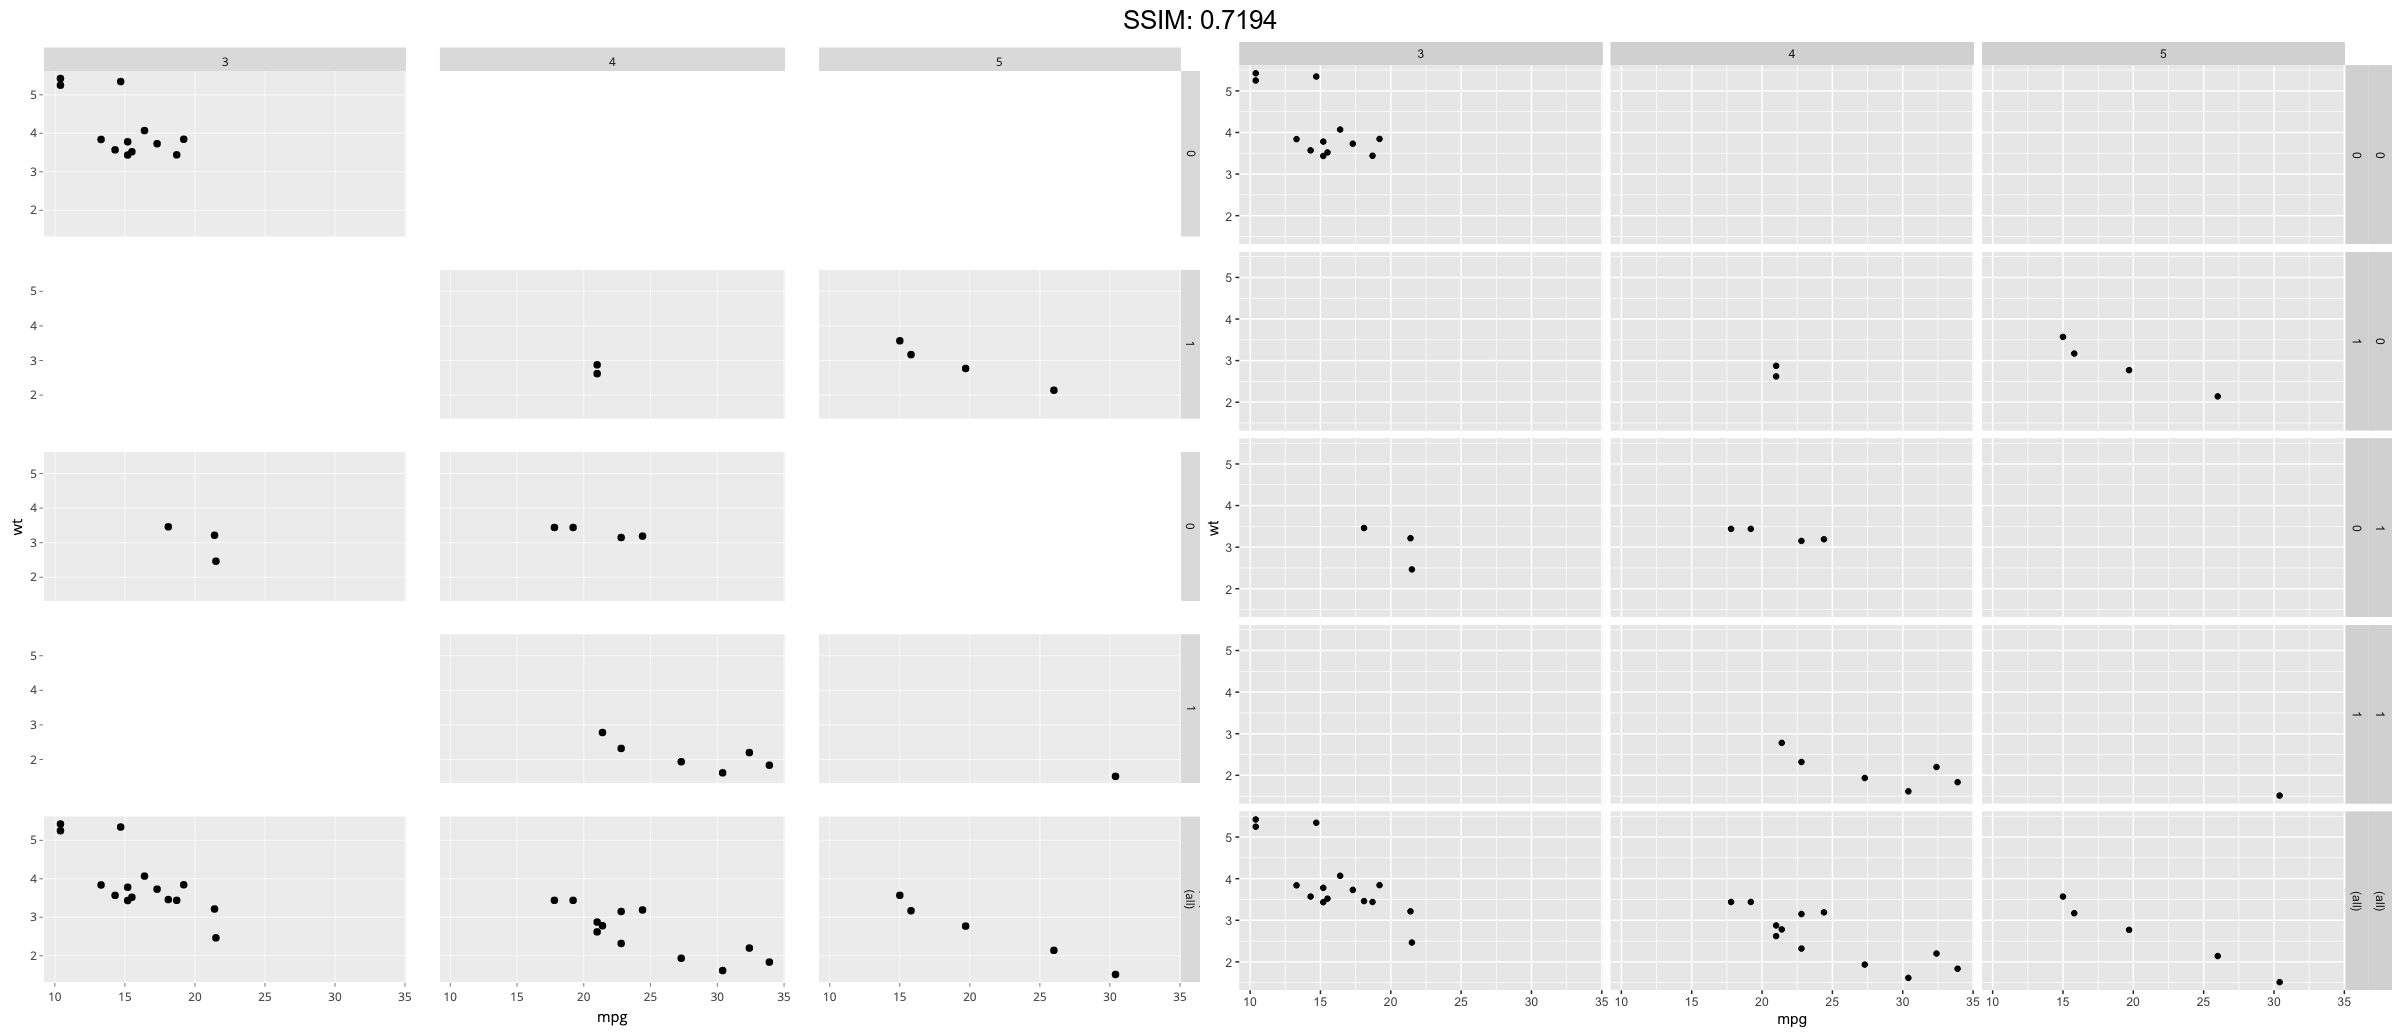
GGPLOT - facet_grid
Forms a matrix of panels defined by row and column faceting variables and then convert them with ggplotly.
p <- ggplot(mpg, aes(displ, cty)) + geom_point()
p <-  p + facet_grid(rows = vars(drv))
plotly::ggplotly(p)

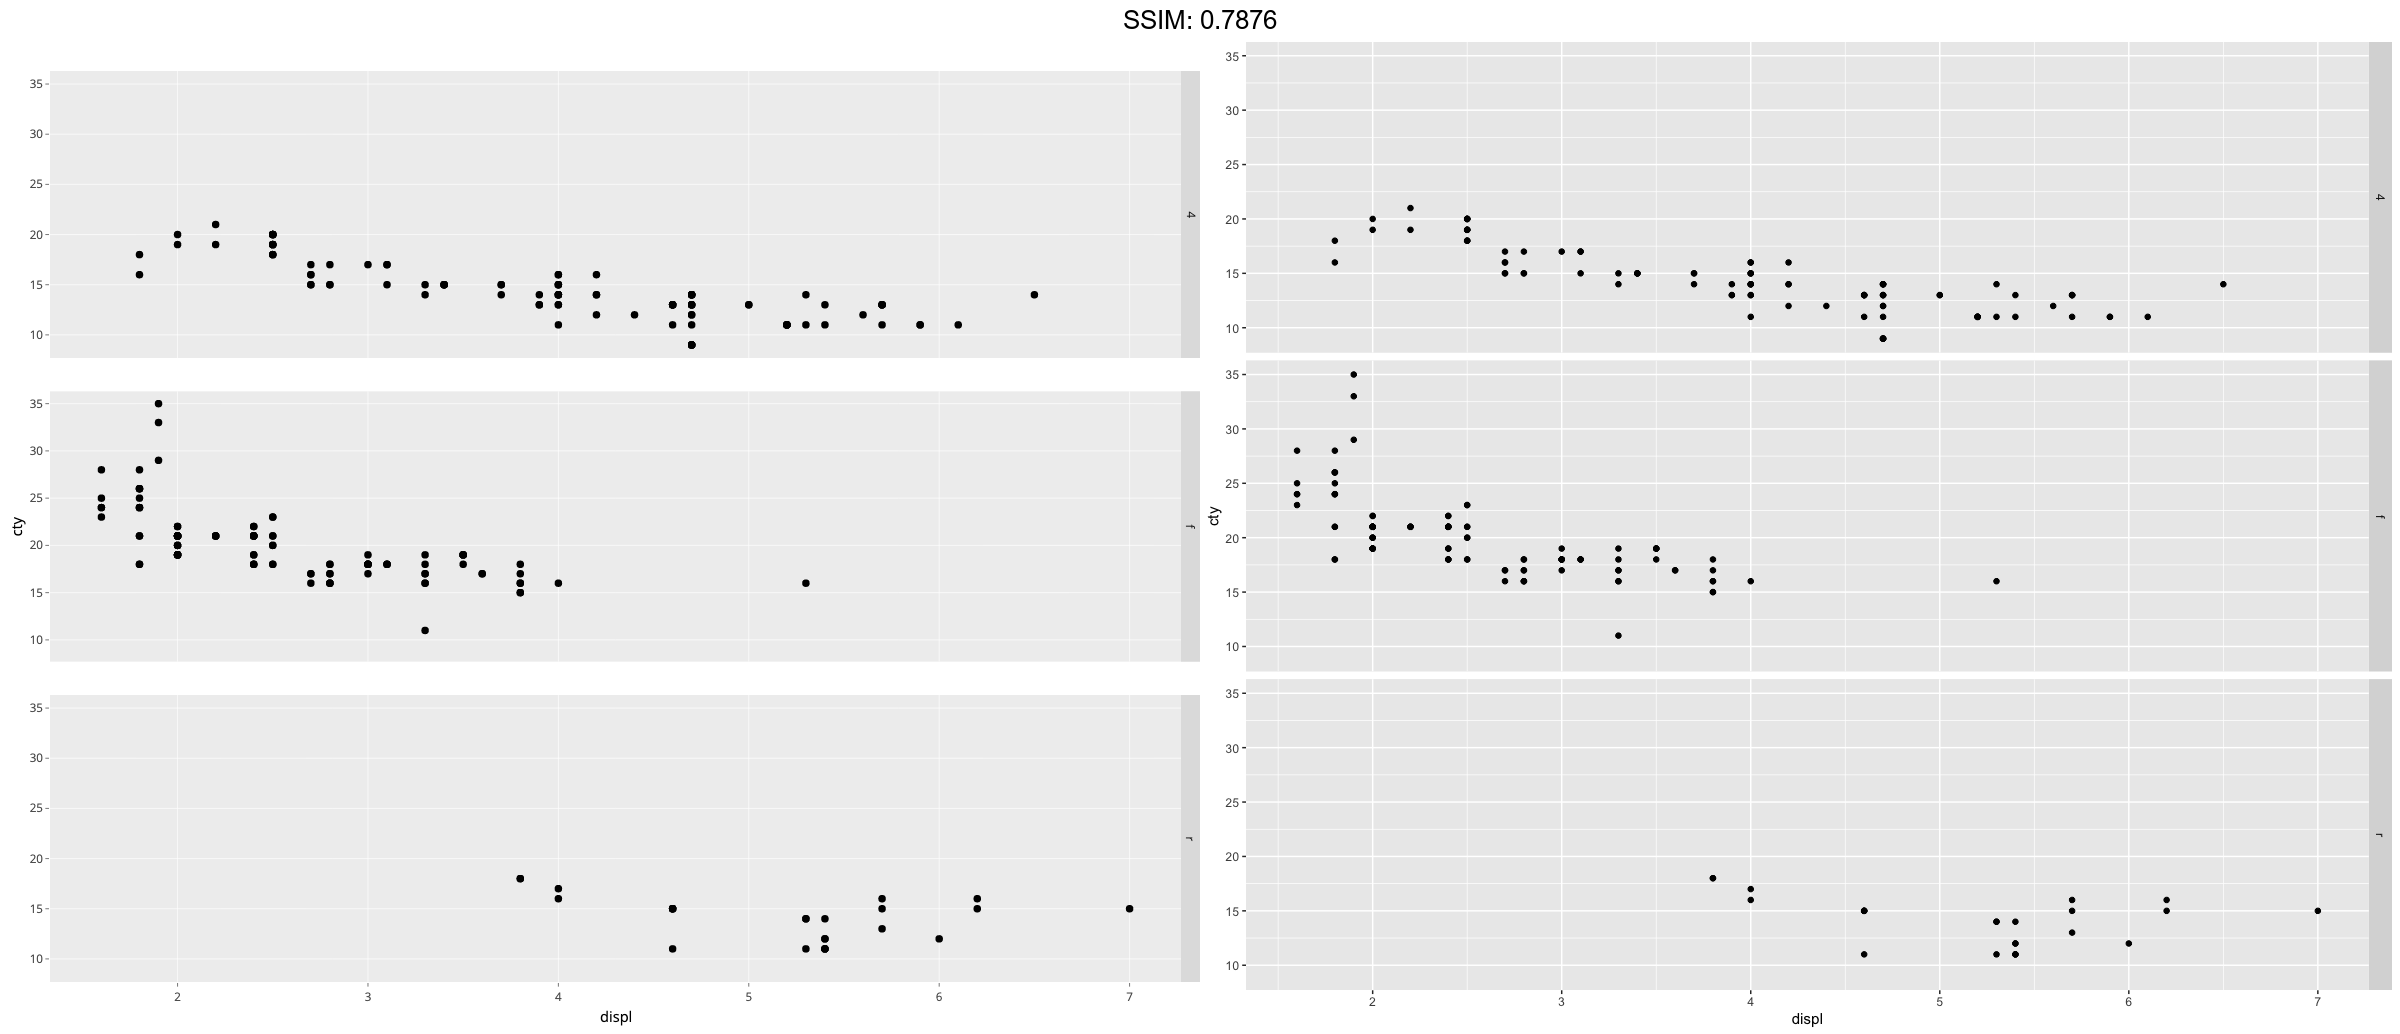

p <- ggplot(mpg, aes(displ, cty)) + geom_point()
p <-  p + facet_grid(cols = vars(cyl))
plotly::ggplotly(p)


p <- ggplot(mpg, aes(displ, cty)) + geom_point()
p <-  p + facet_grid(vars(drv), vars(cyl))
plotly::ggplotly(p)


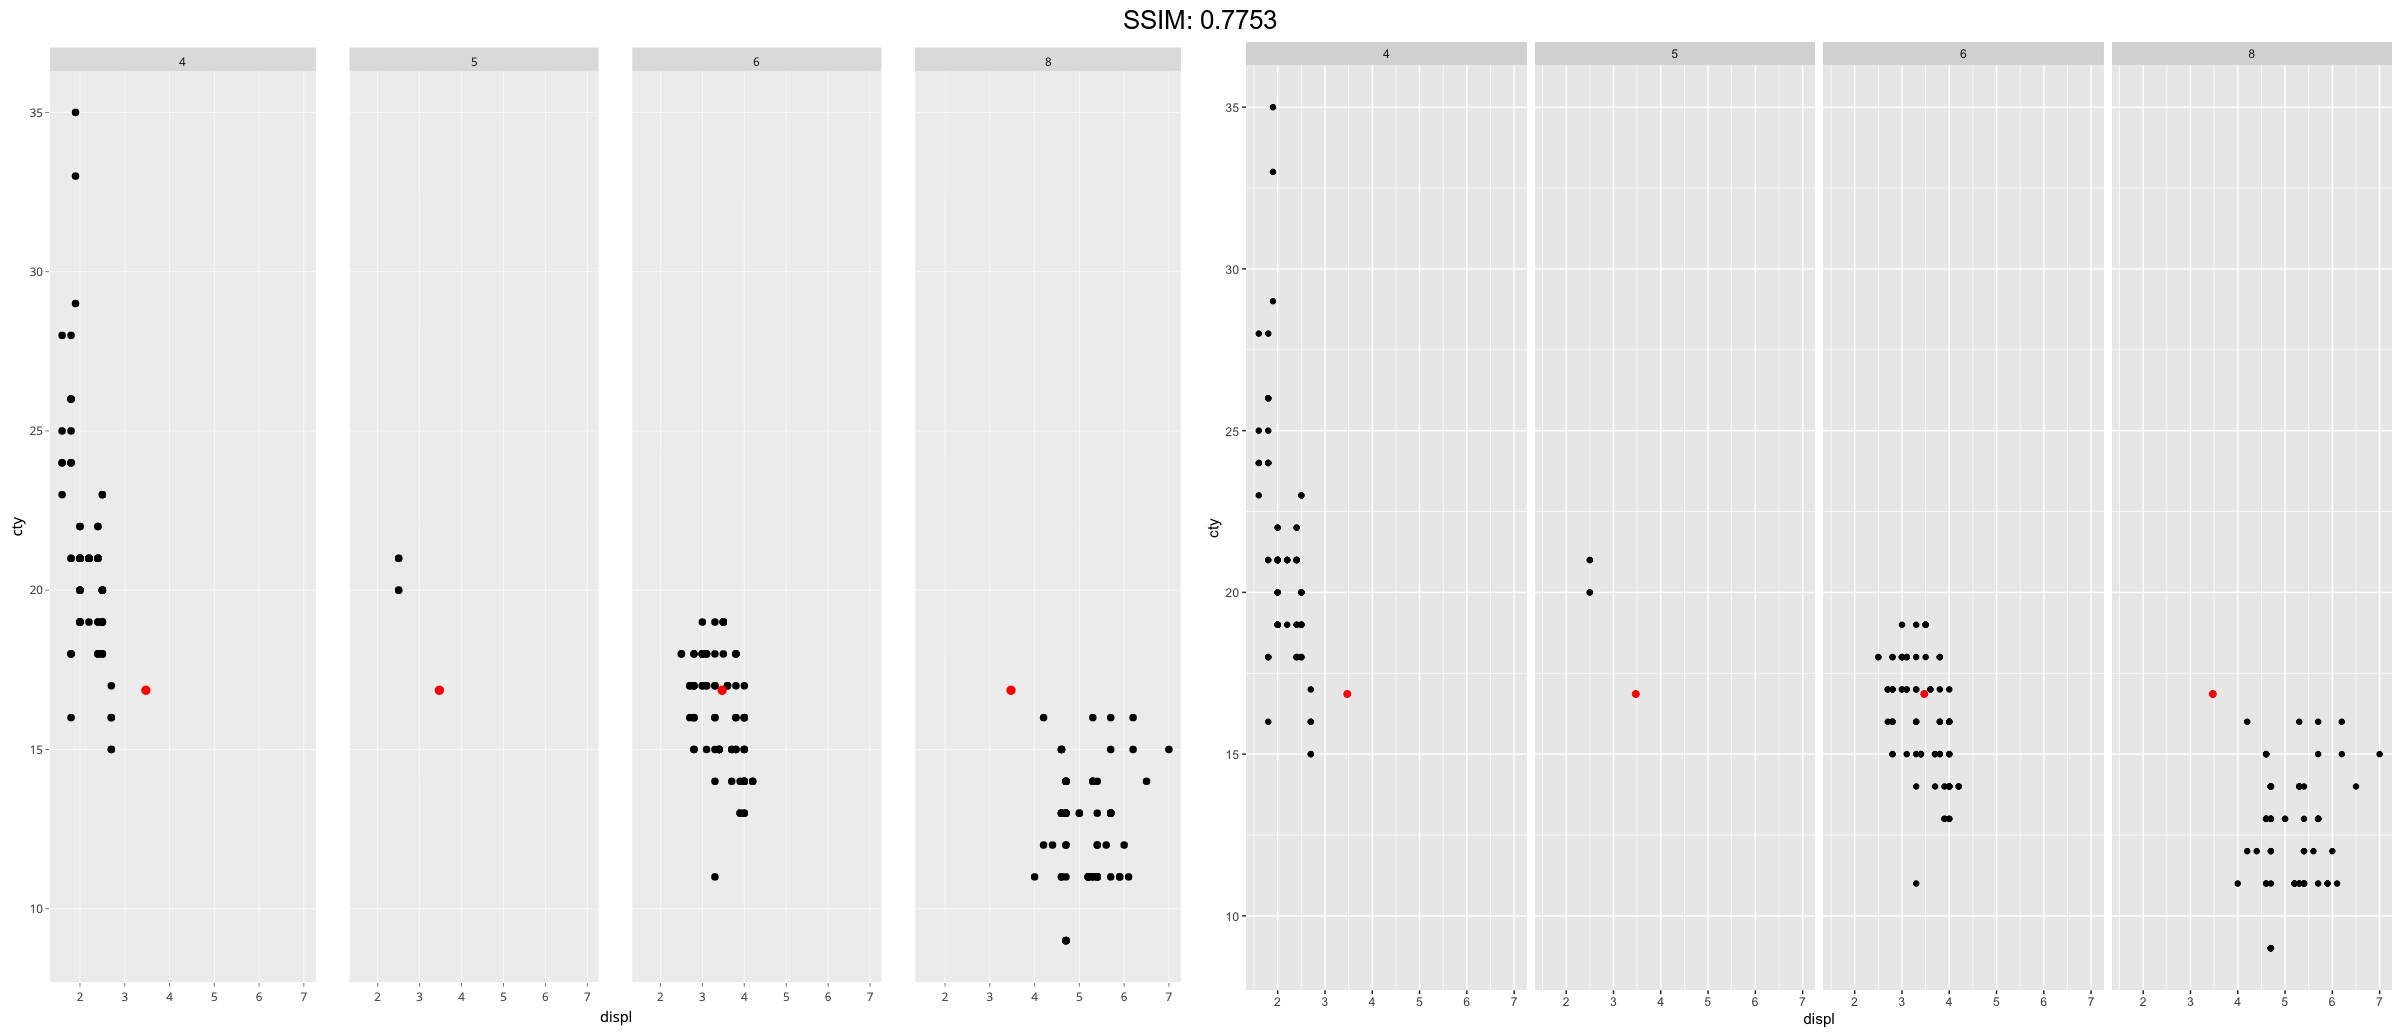
p <- ggplot(mpg, aes(displ, cty)) + geom_point()
df <- data.frame(displ = mean(mpg$displ), cty = mean(mpg$cty))
p <-
 p +
  facet_grid(cols = vars(cyl)) +
  geom_point(data = df, colour = "red", size = 2)
plotly::ggplotly(p)

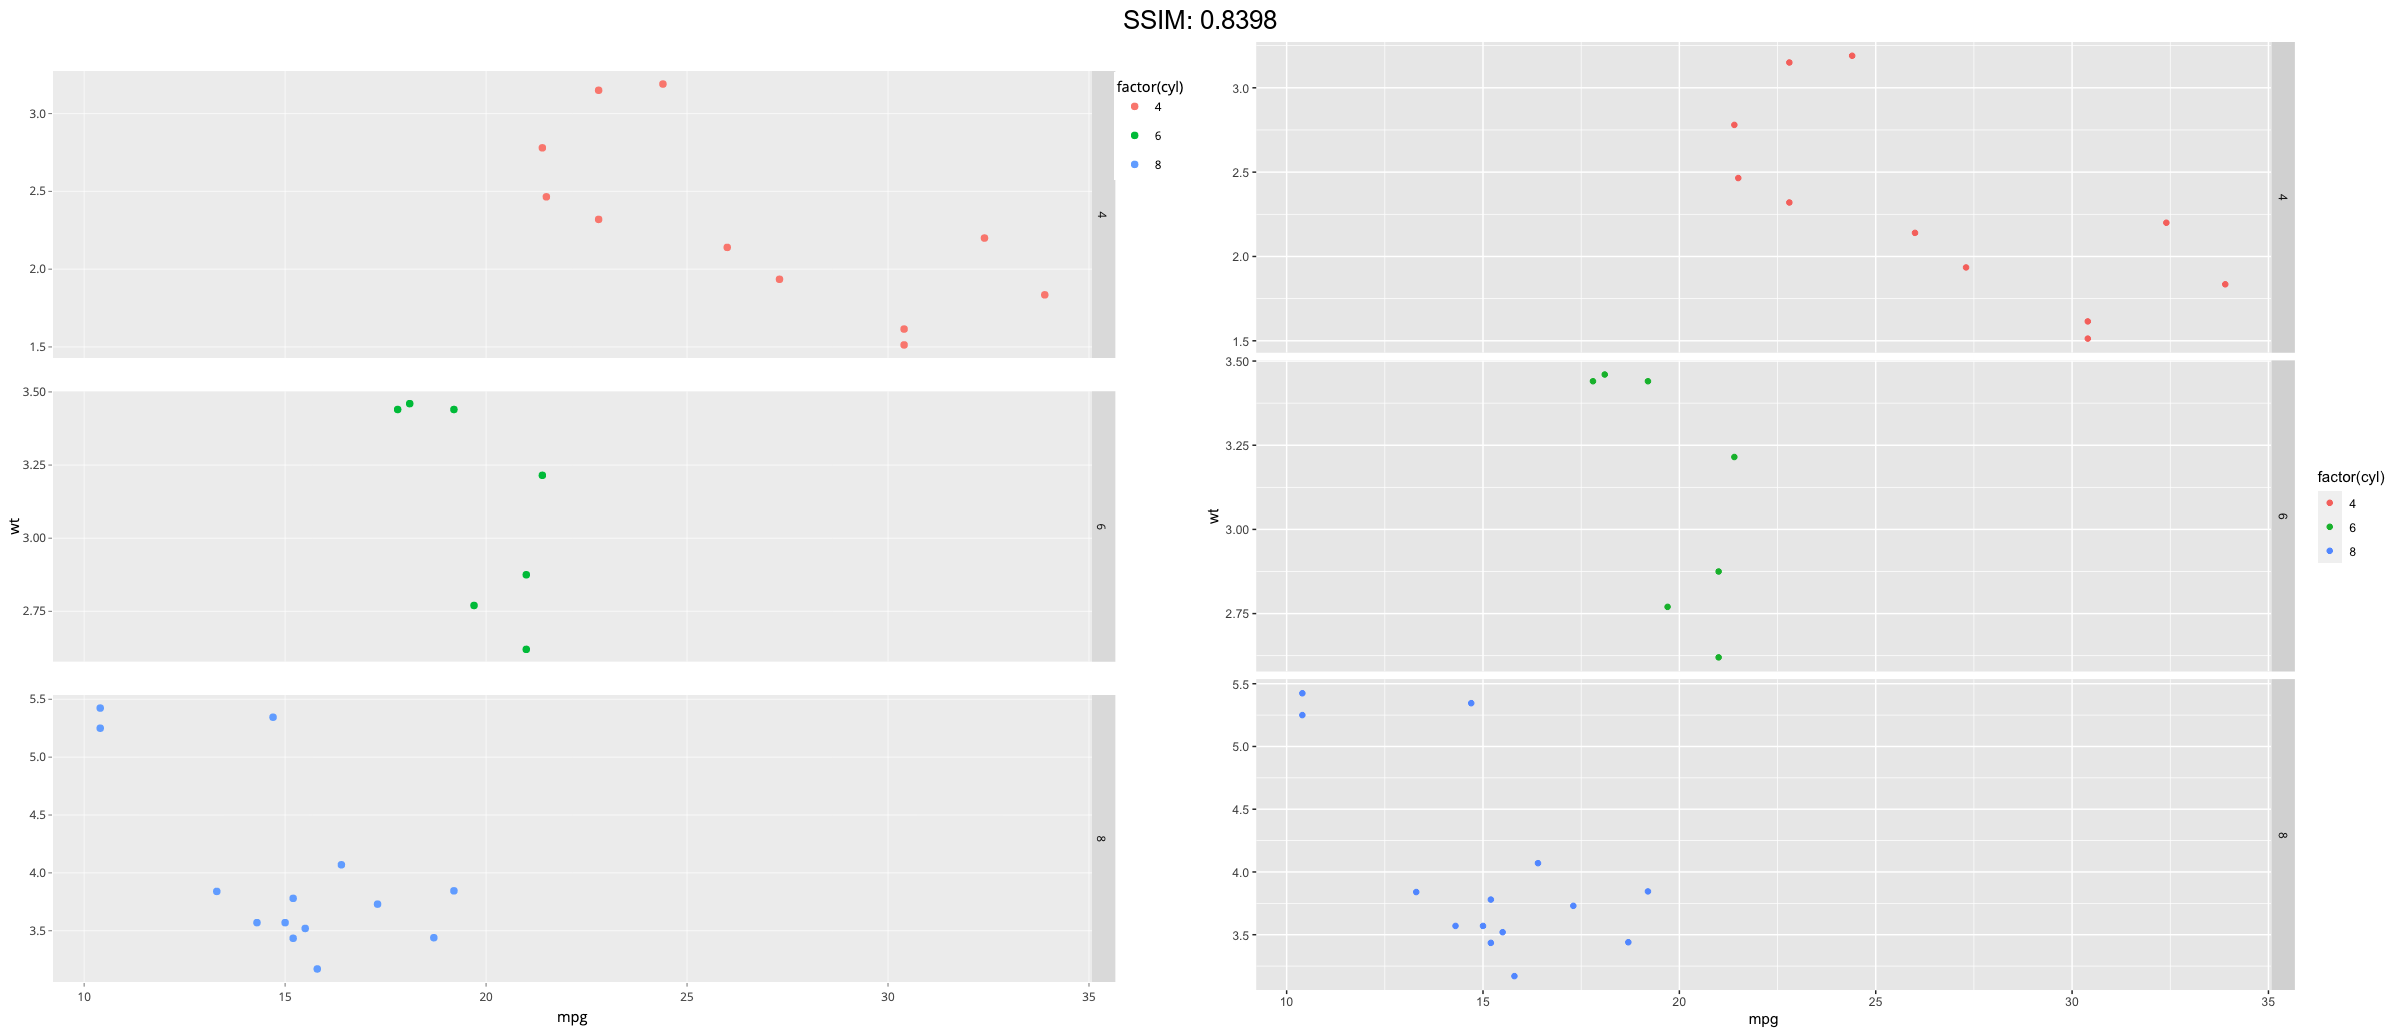
mt <- ggplot(mtcars, aes(mpg, wt, colour = factor(cyl))) +
  geom_point()
p <-  mt + facet_grid(vars(cyl), scales = "free")
plotly::ggplotly(p)

p <-
 ggplot(mpg, aes(drv, model)) +
  geom_point() +
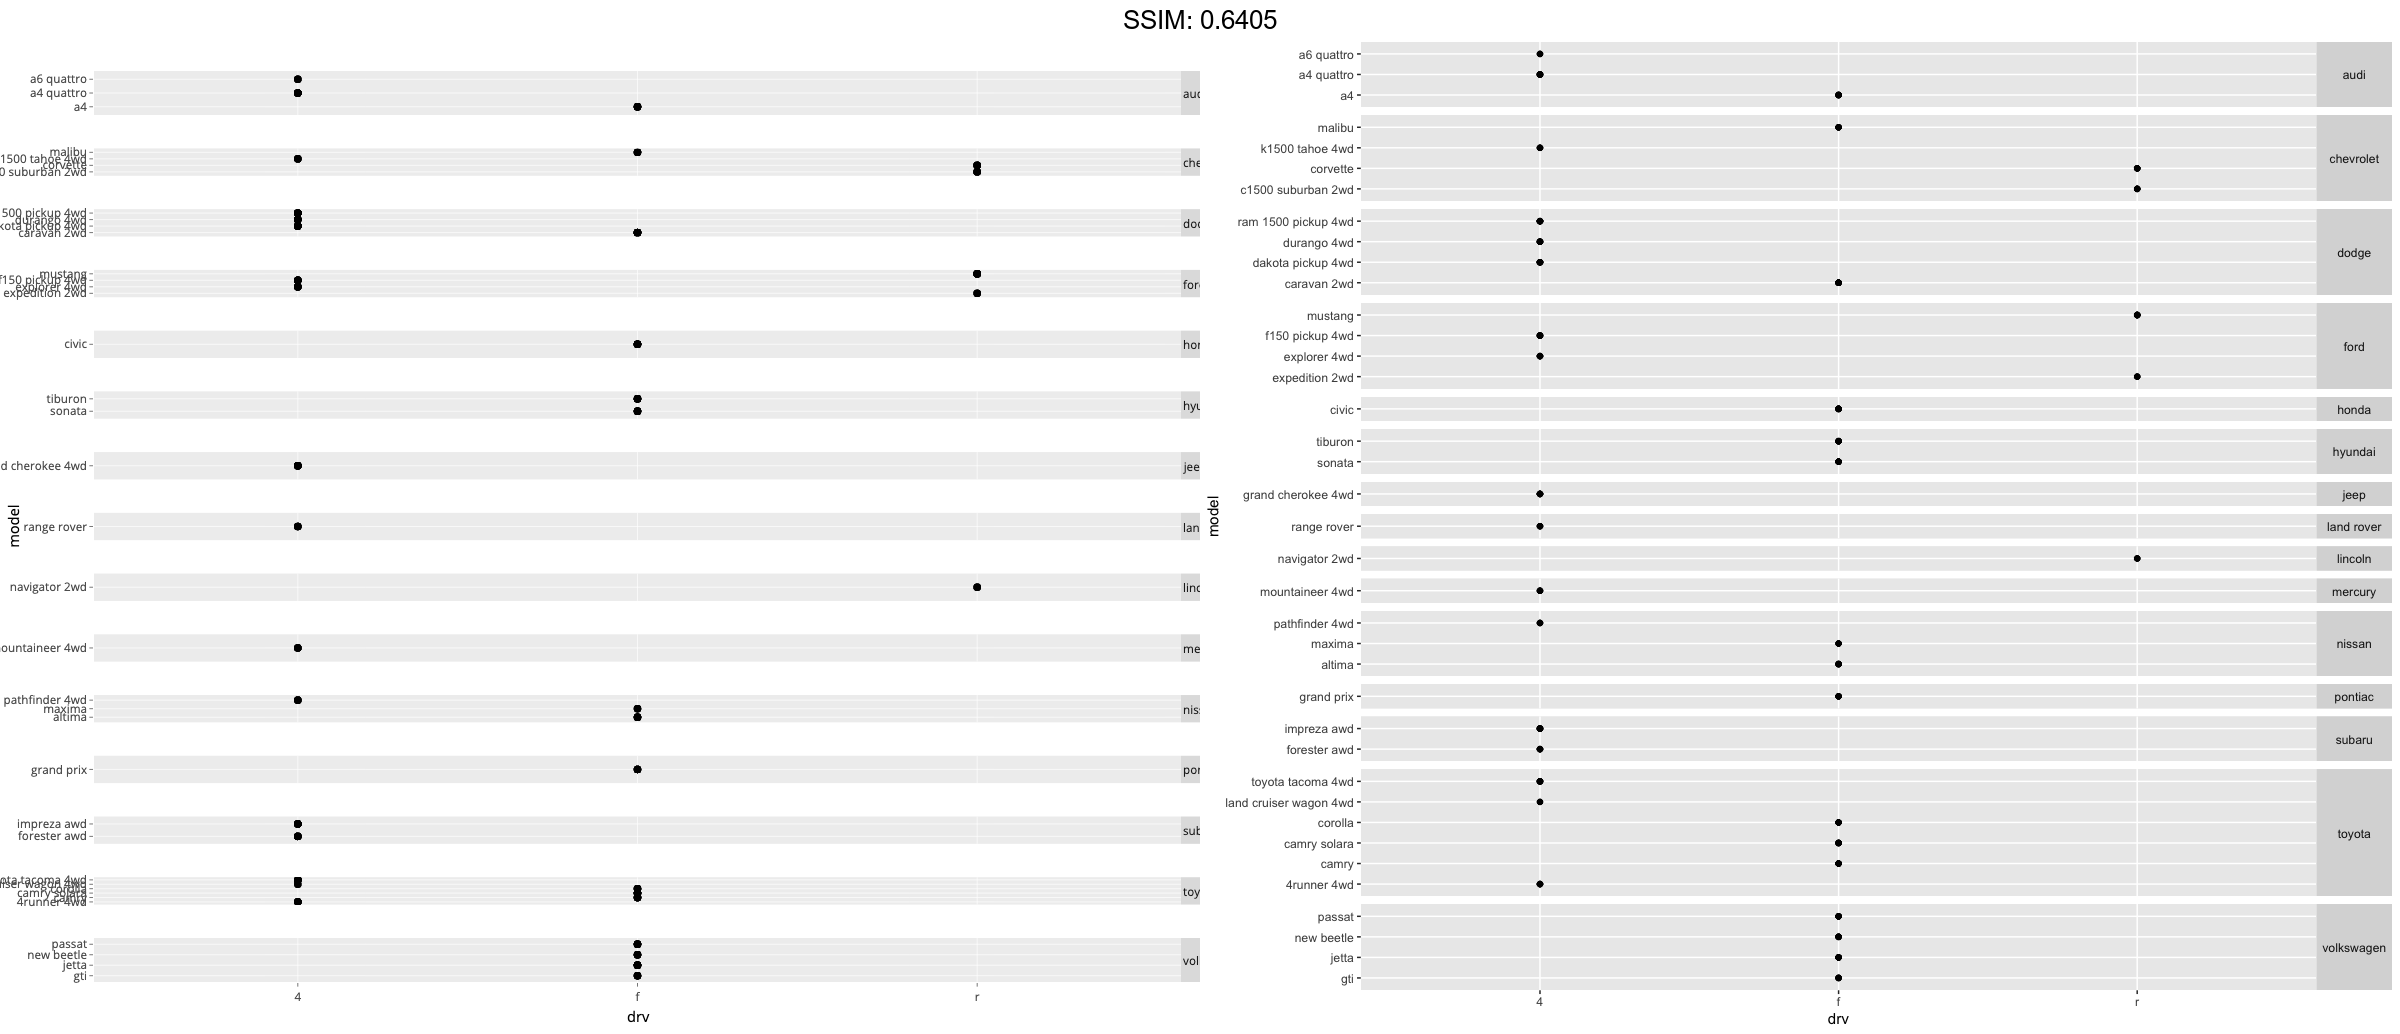
  facet_grid(manufacturer ~ ., scales = "free", space = "free") +
  theme(strip.text.y = element_text(angle = 0))
plotly::ggplotly(p)

mg <- ggplot(mtcars, aes(x = mpg, y = wt)) + geom_point()
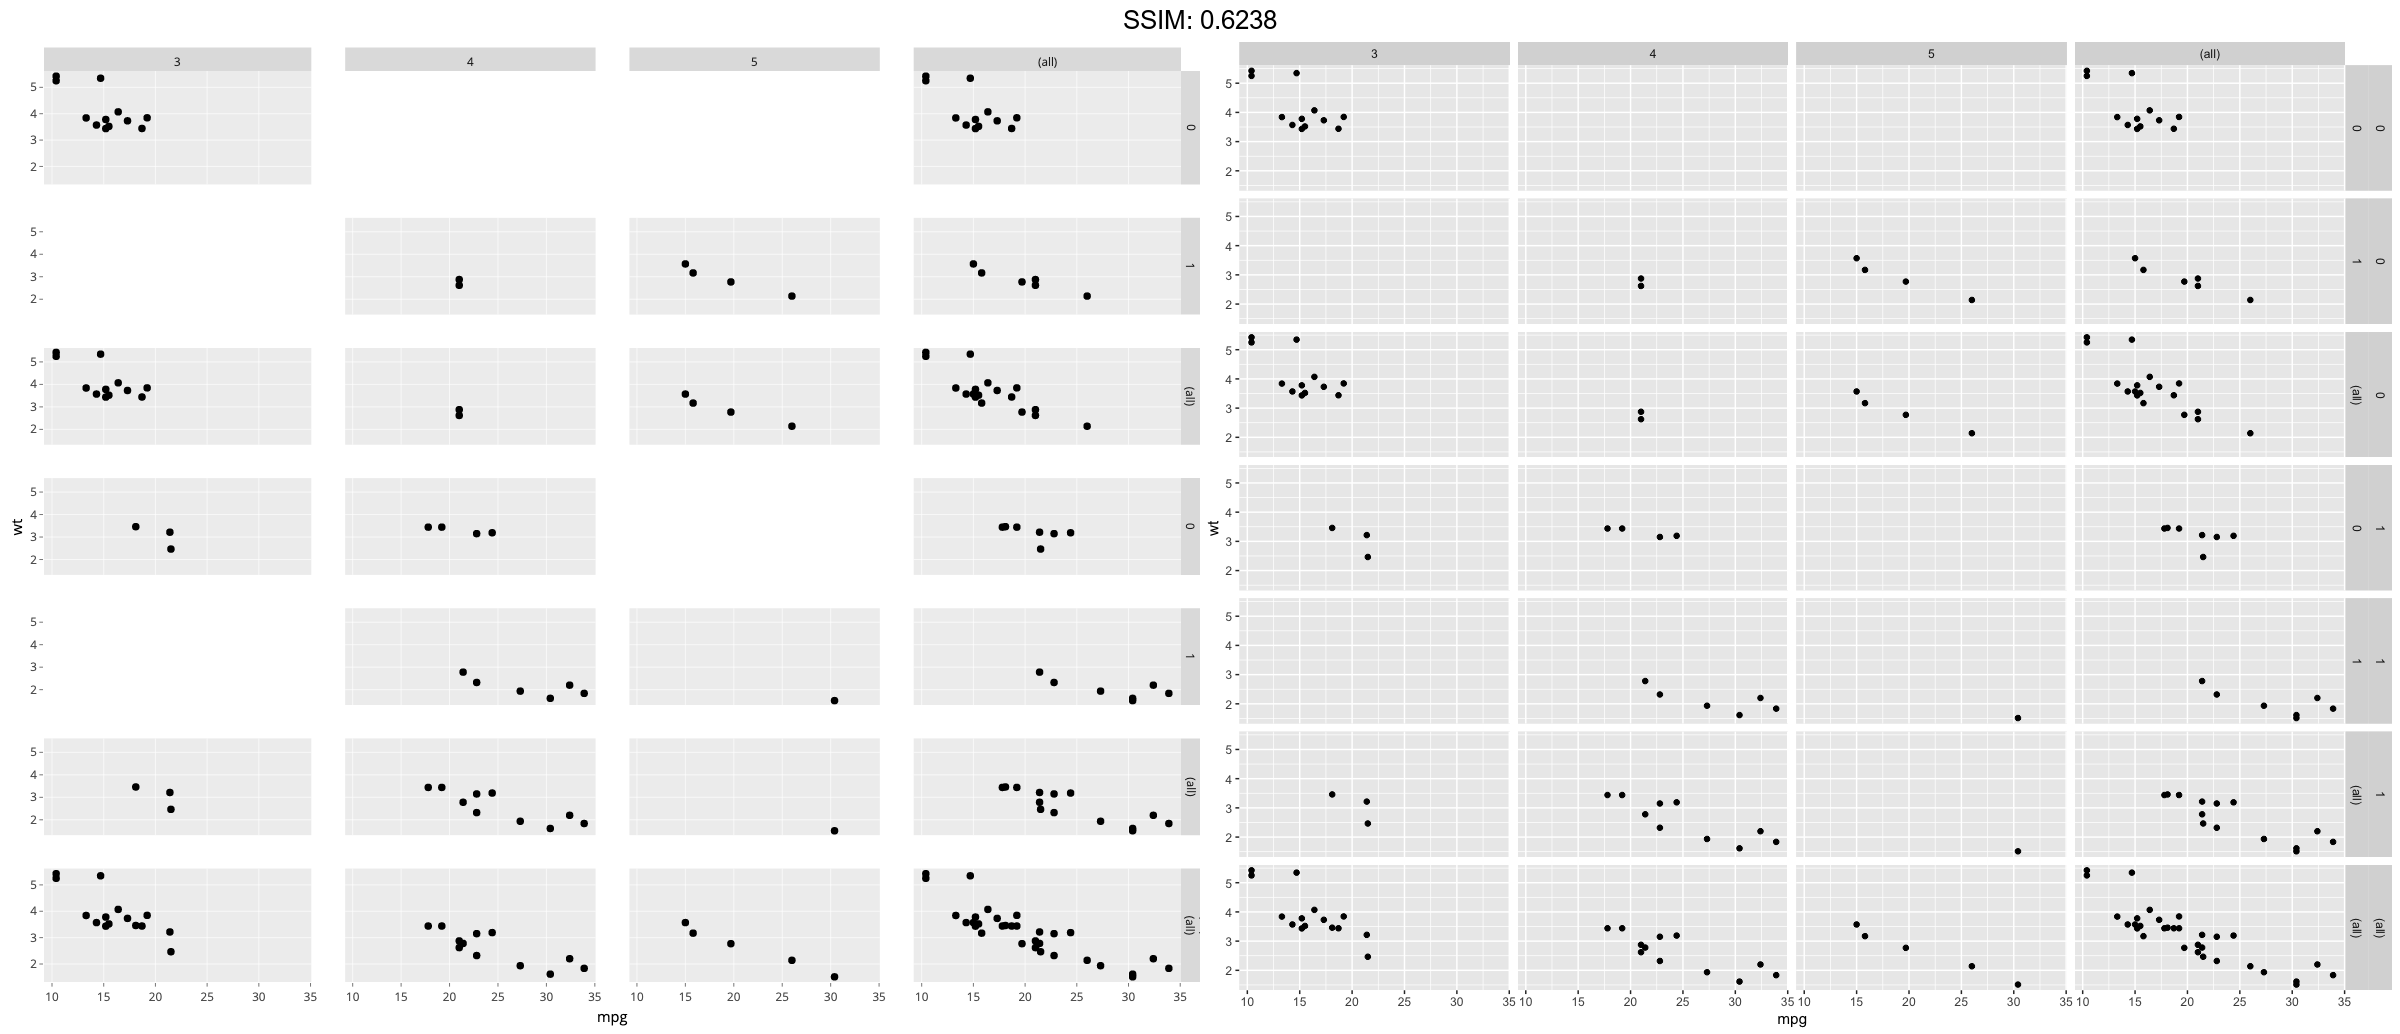
p <-  mg + facet_grid(vs + am ~ gear, margins = TRUE)
plotly::ggplotly(p)

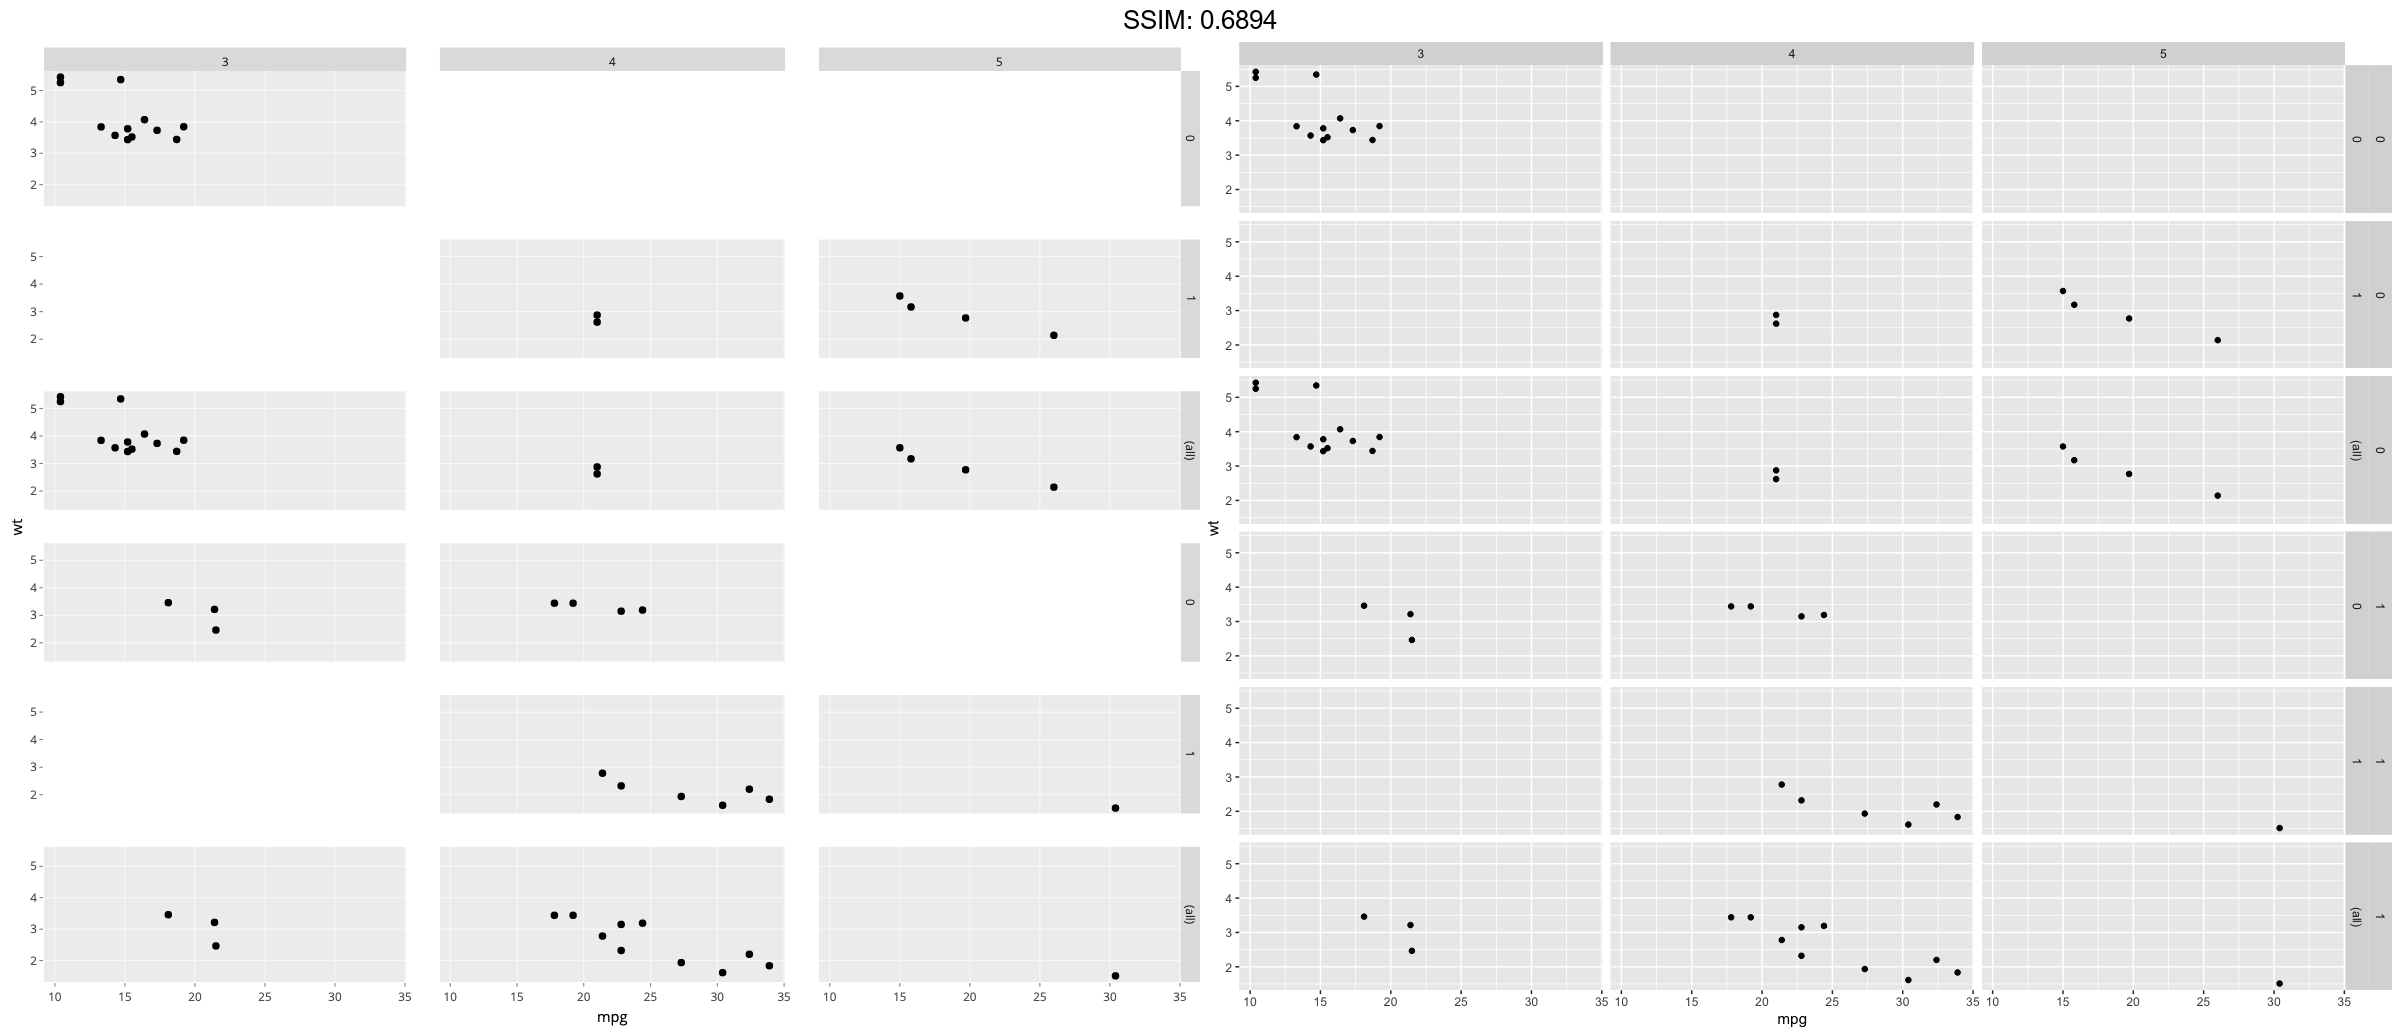
mg <- ggplot(mtcars, aes(x = mpg, y = wt)) + geom_point()
p <-  mg + facet_grid(vs + am ~ gear, margins = "am")
plotly::ggplotly(p)

mg <- ggplot(mtcars, aes(x = mpg, y = wt)) + geom_point()
p <-  mg + facet_grid(vs + am ~ gear, margins = "vs")
plotly::ggplotly(p)

