View Plots
Get to know your plot's view page
Intro to the View Plot
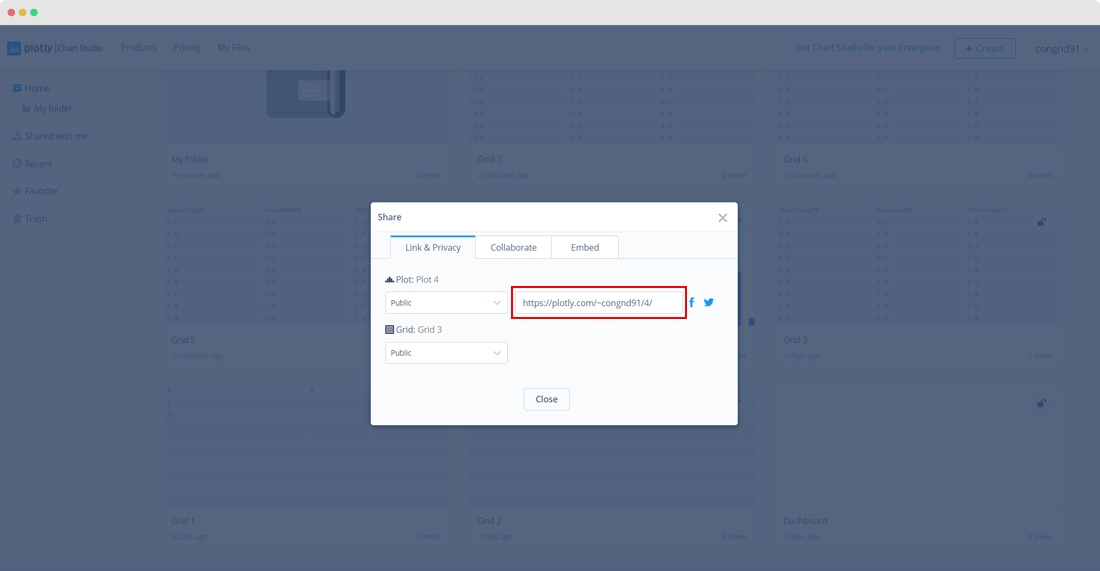
When you save and embed your plot, the shareable link directs you to your shareplot viewer.
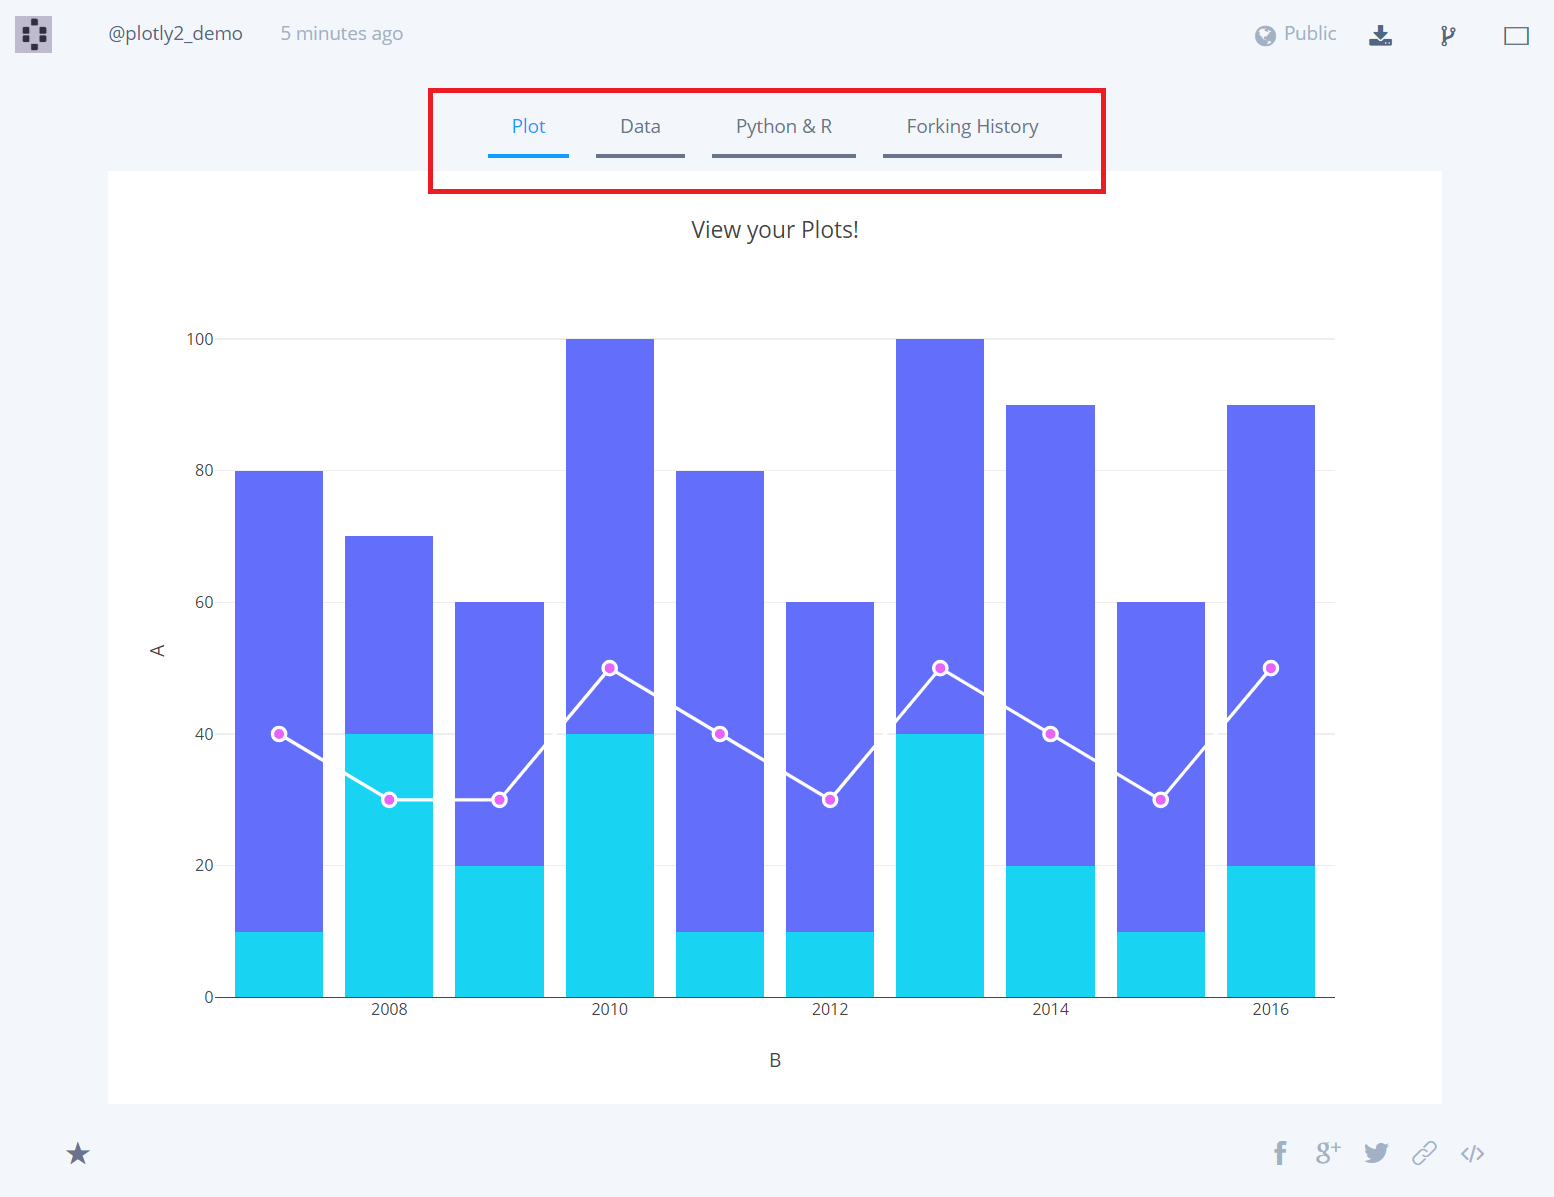
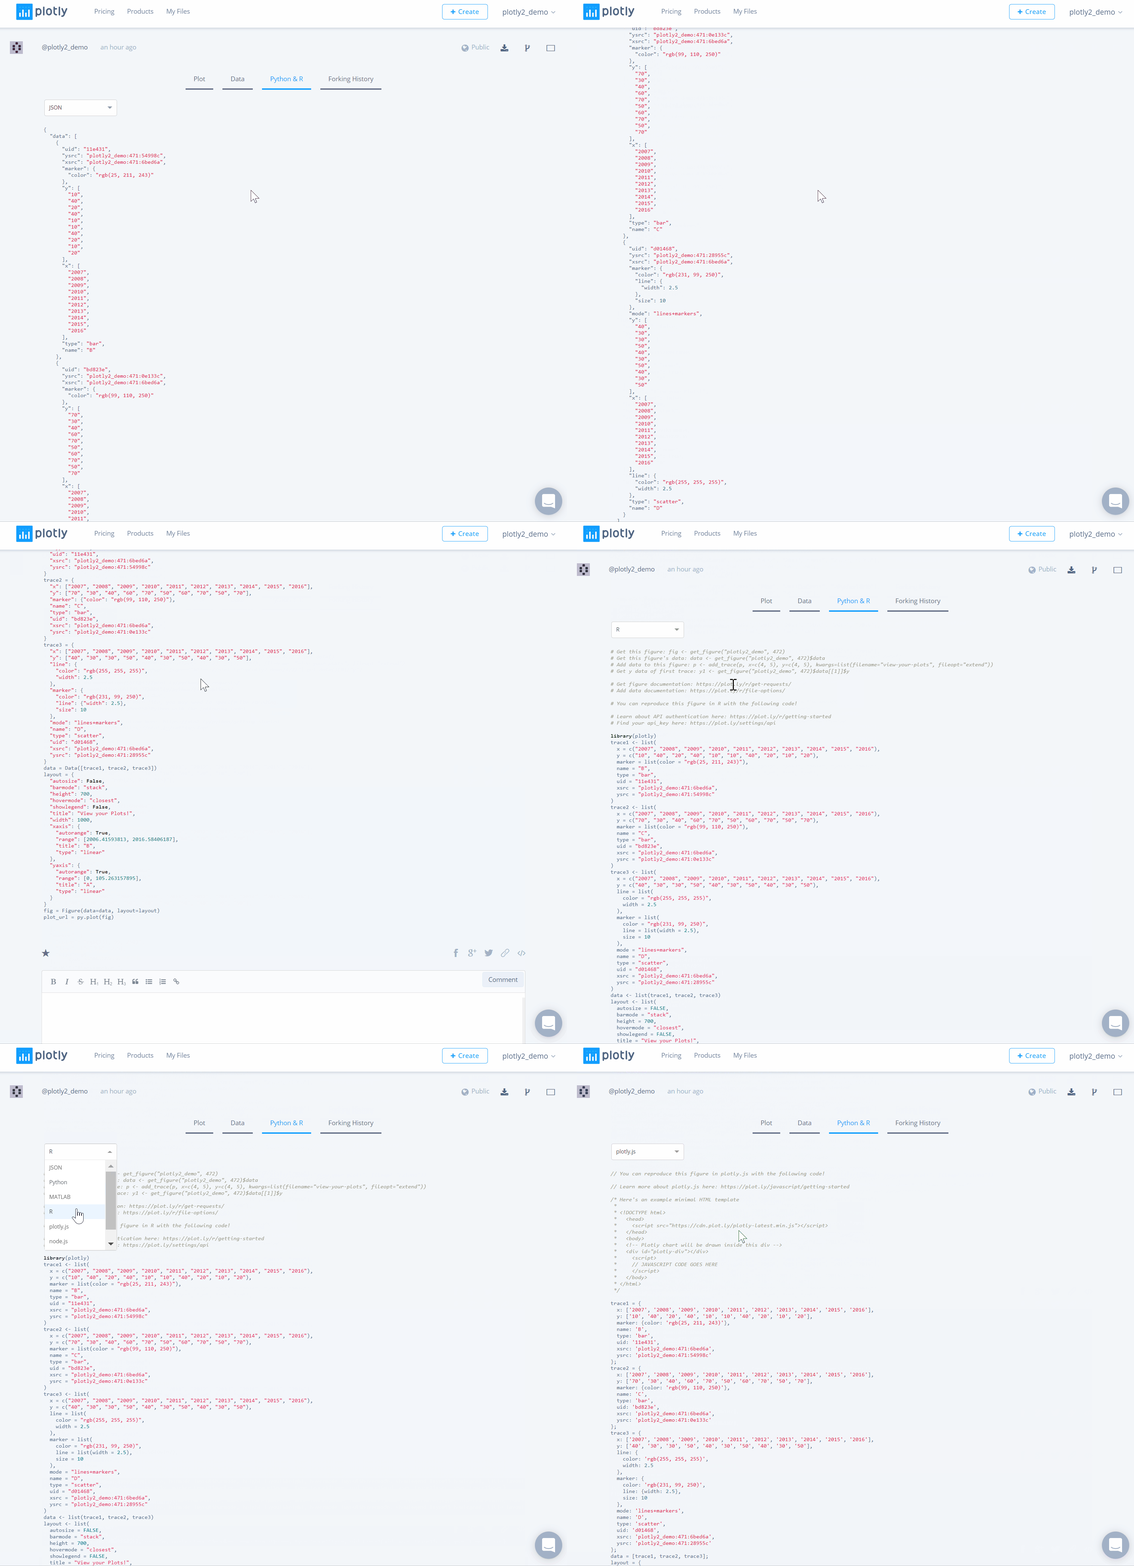
The View Plot page is where you'll view not only the plot, but its data, code, and the forging history.
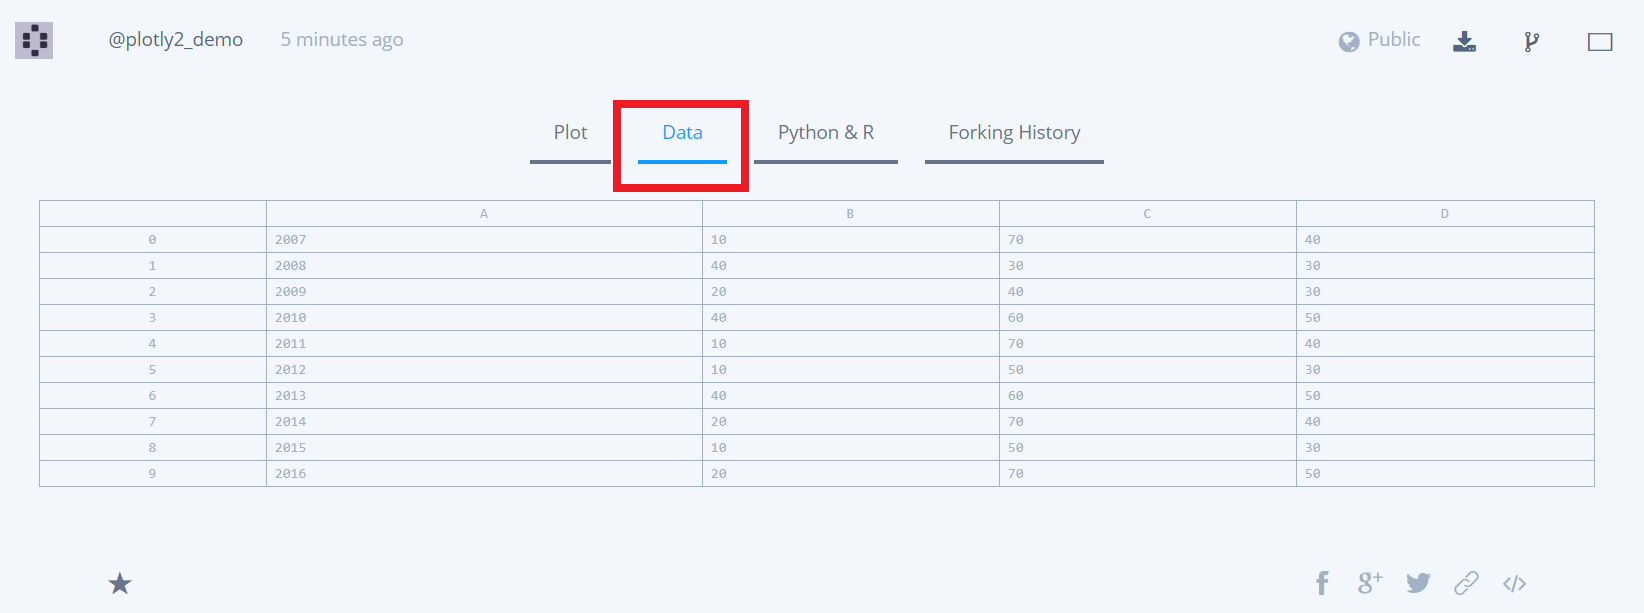
Clicking the 'Data' tab will show the plot's data. The entire dataset may not be displayed if it's too large, but rest assured that the entire grid has been saved. The ellipses appear when this is the case.
The 'Python & R' tab will display the plot's code, JSON being the default programming language. Select from the dropdown menu on the left-hand side to see the others, including Python, Matlab and R.
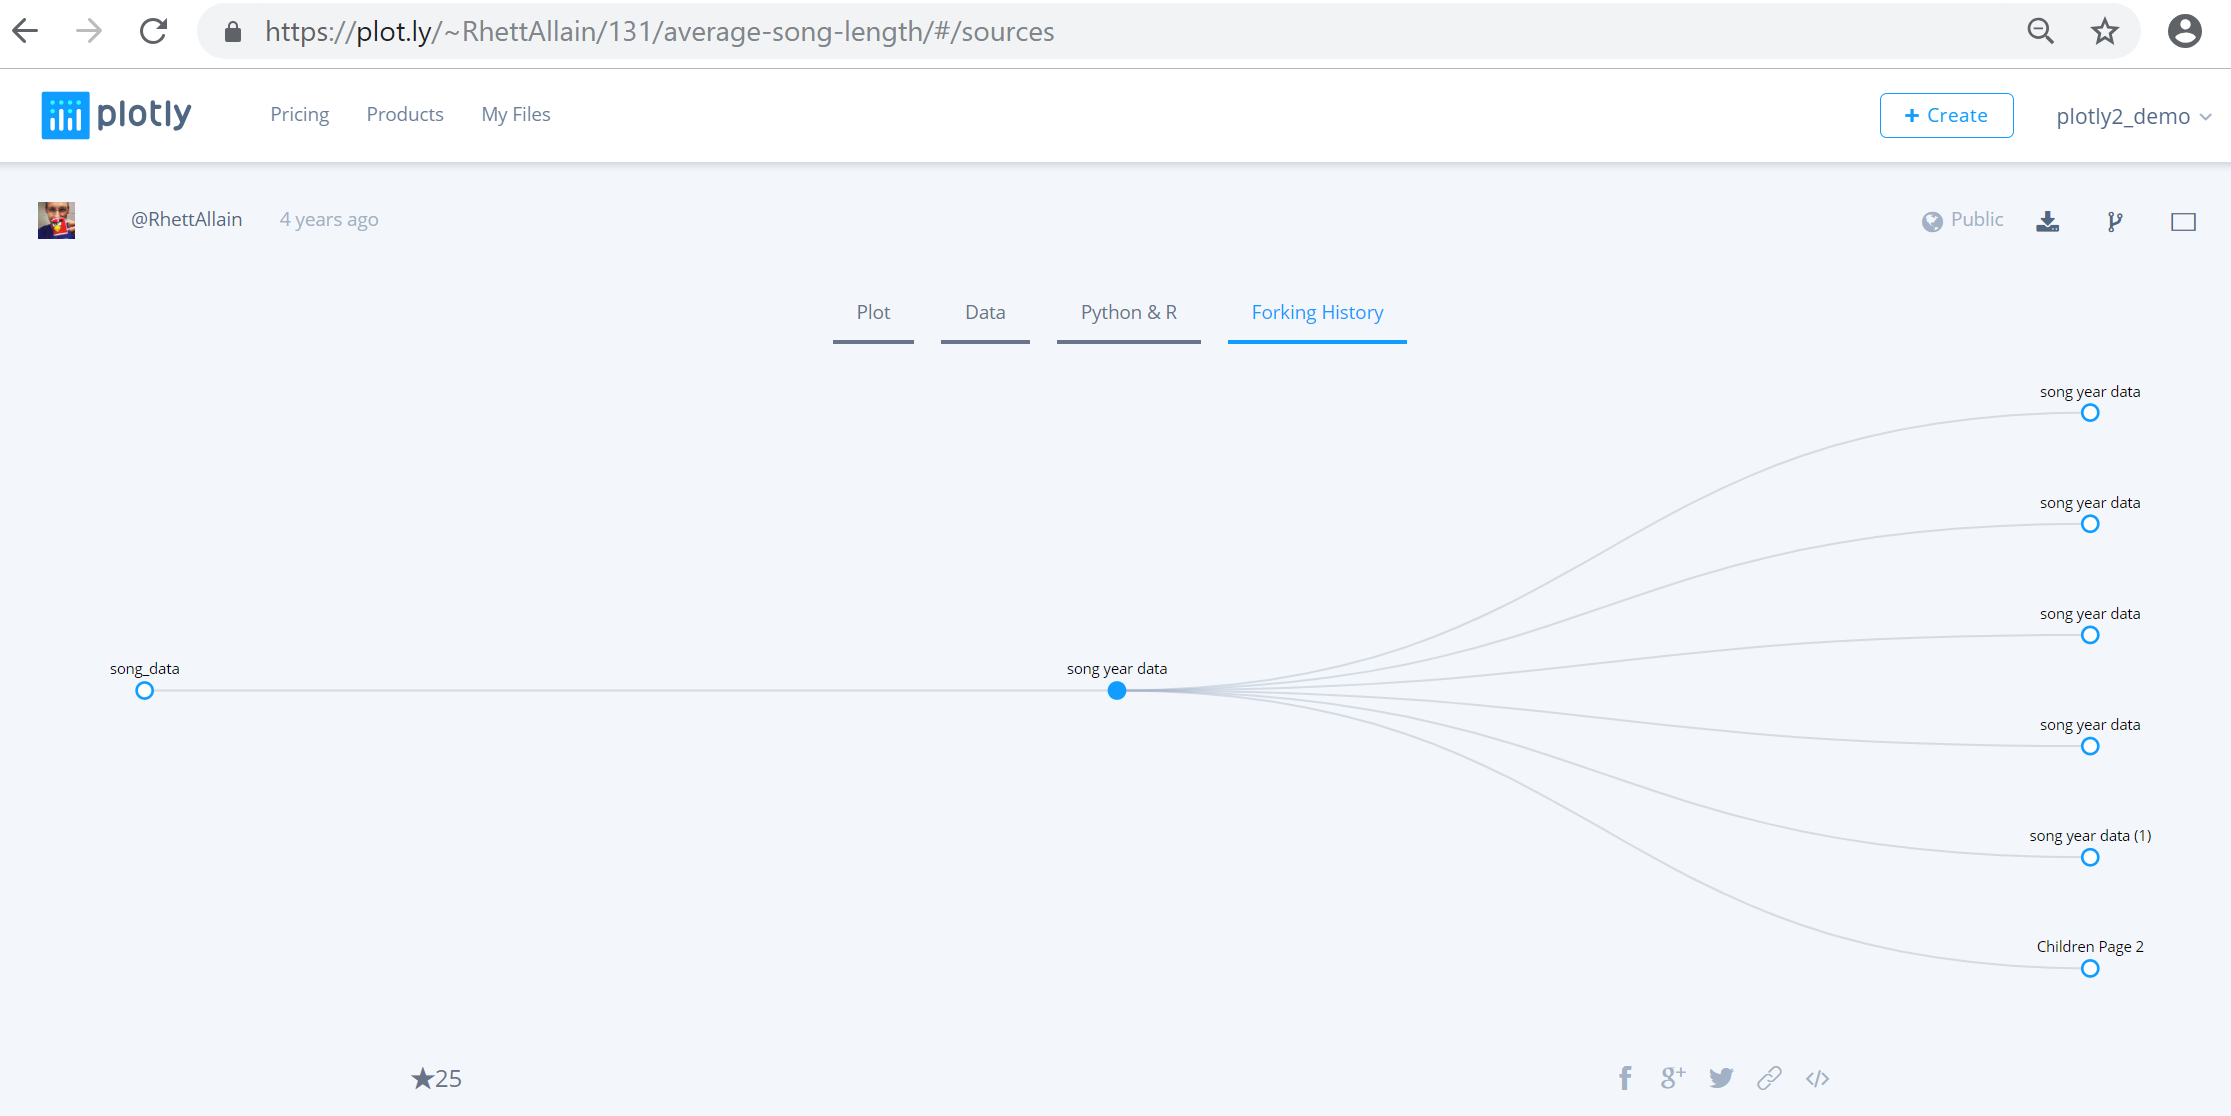
The 'Forging History'tab displays the history of the data is shared between Chart Studio users for audit control. How does this work? When you click on 'Fork & Edit' on another Chart Studio user's chart, a new node is created in the 'Forging History' tree. The example below is a plot created by 'Wired' author Rhett Allain. It's been forked many times by other Chart Studio users.
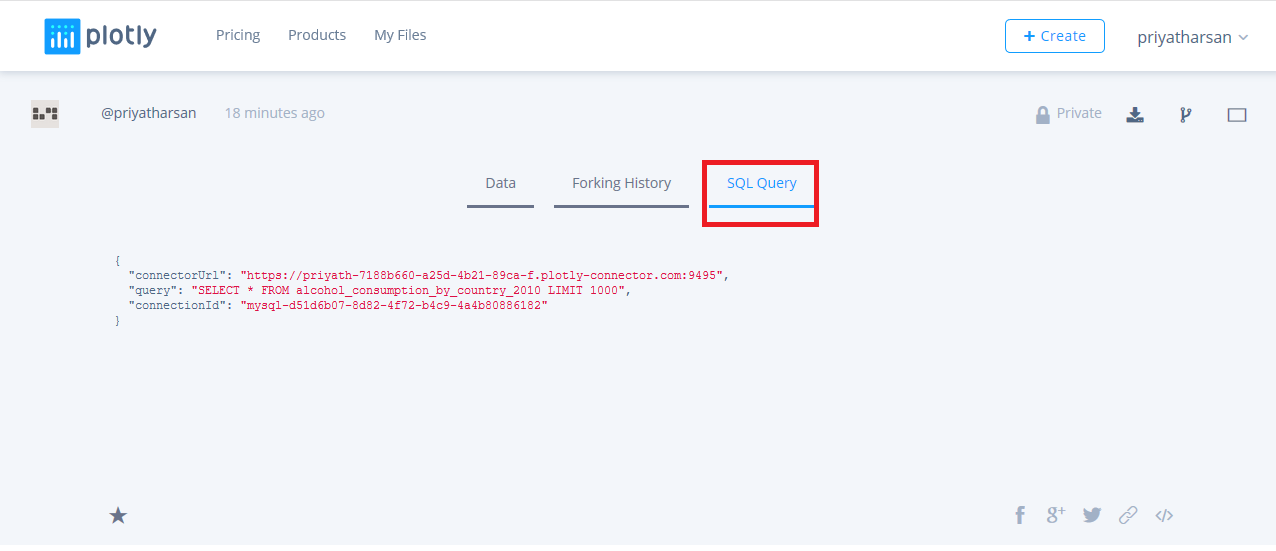
When viewing a grid (instead of a plot), you'll only be able to see its data and forking history, and additionally one more tab called 'SQL Query' that displays the connection details associated with the grid queried via the Falcon API.
How can you get to the View Plot page if you don't have the shareable link handy? Keep reading to find out!
From the Chart Studio Homepage
The 'organize' page, also known as your 'list of files', is nothing but the homepage of your Chart Studio account. This is where your saved plots and grids are kept.
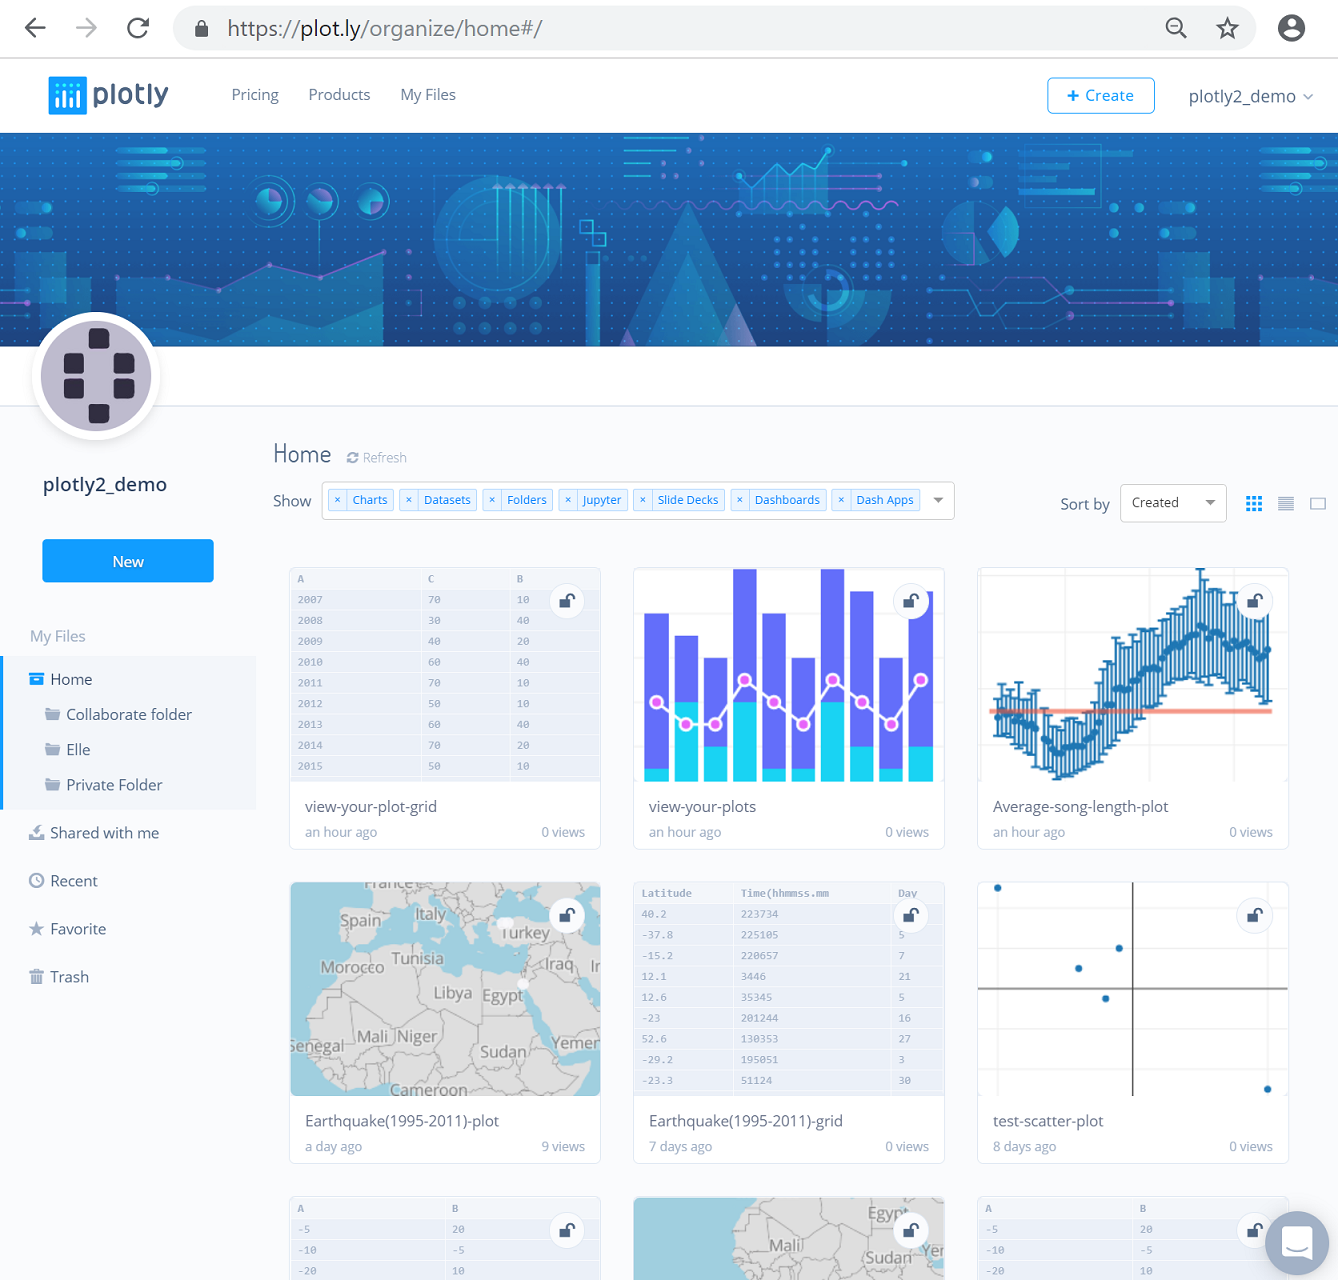
Hover over the thumbnail of the plot you'd like to view and click the'View' button.
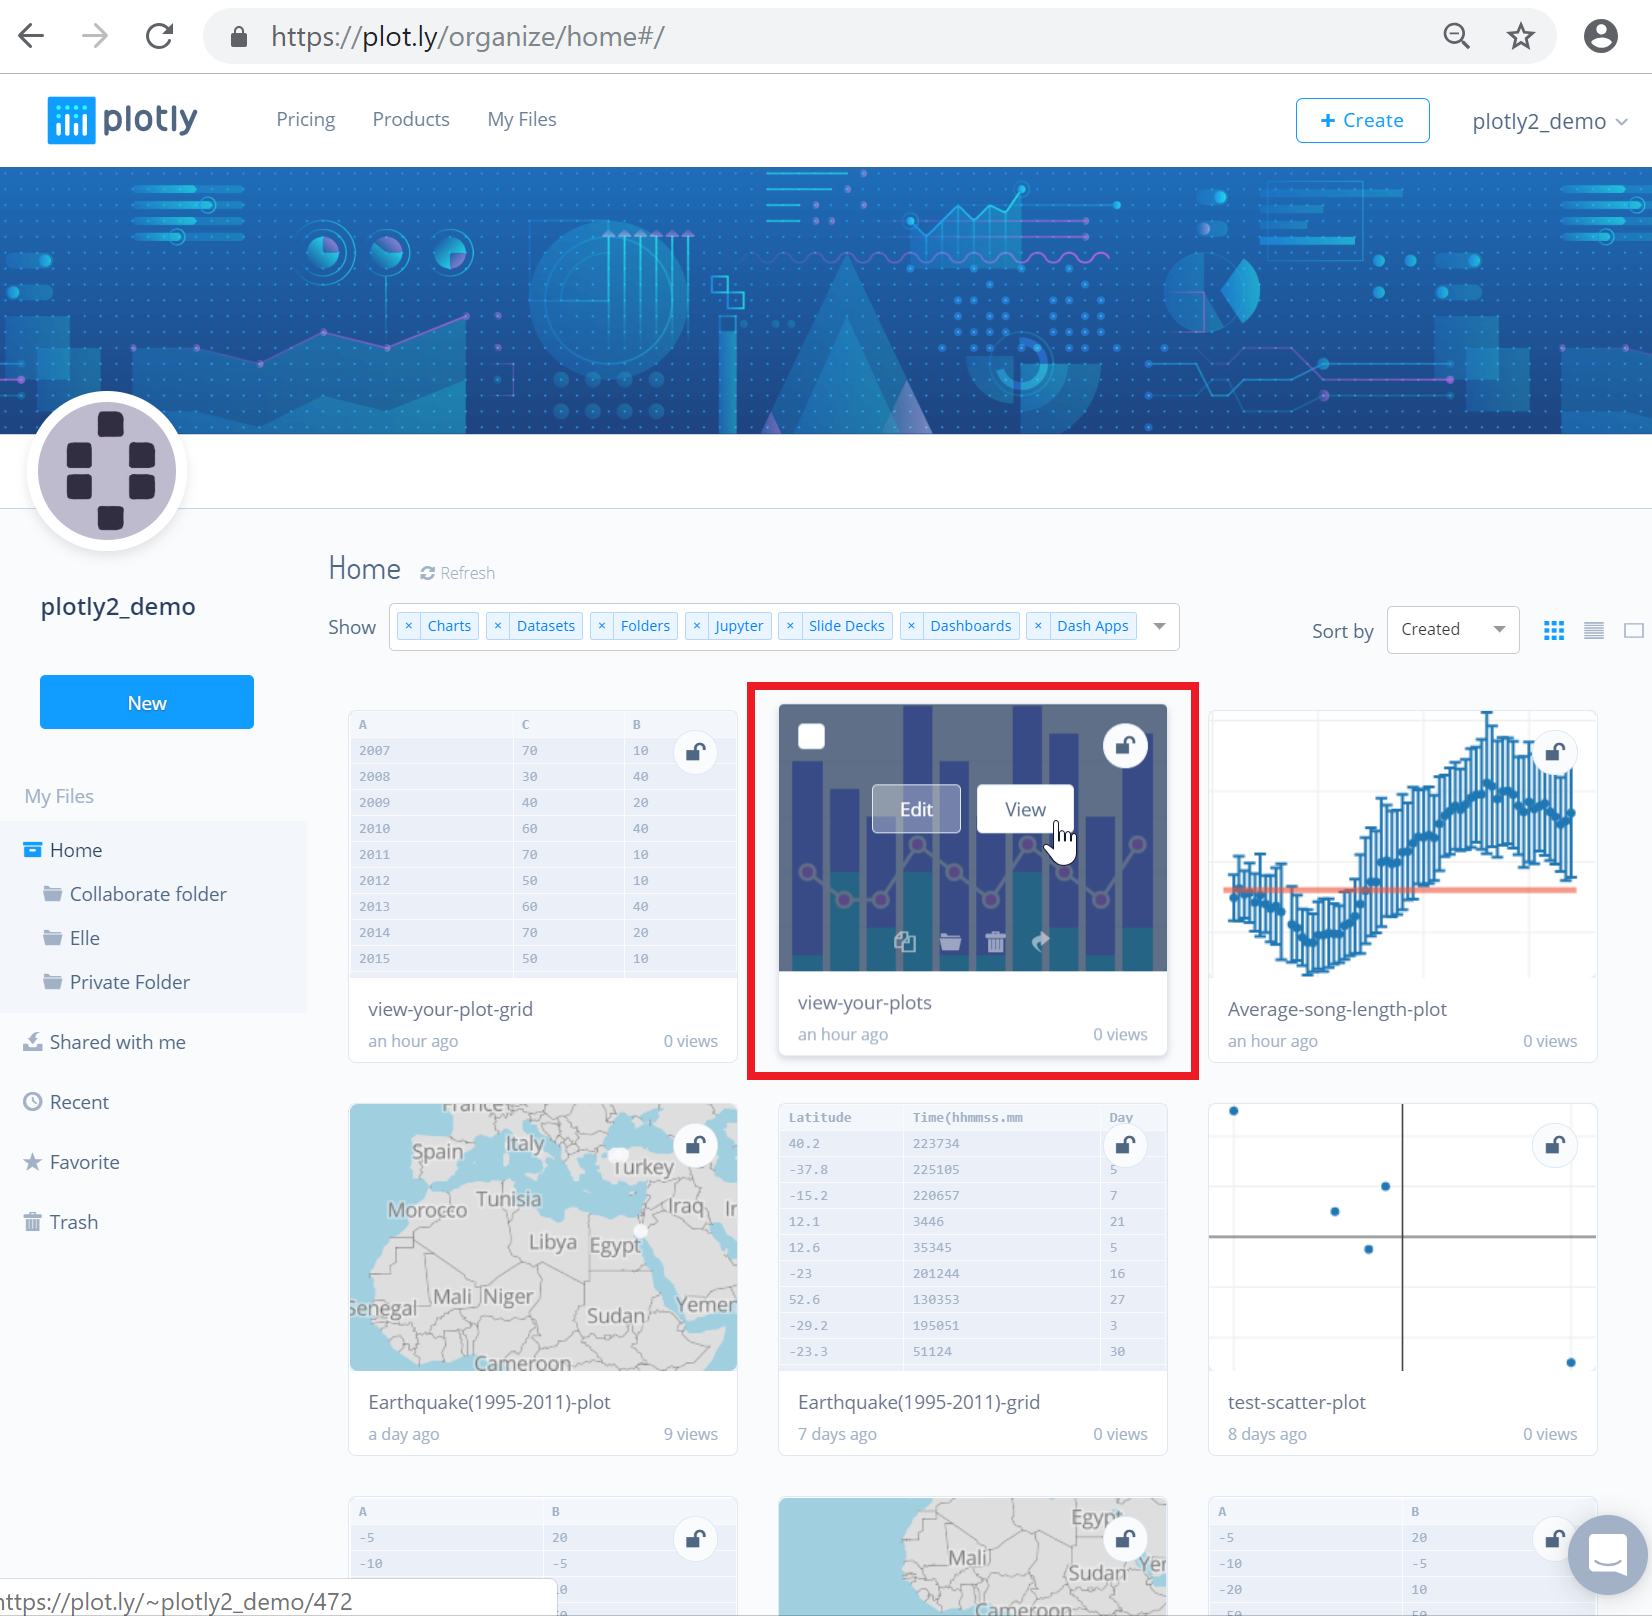
It'll direct you to the View Plot page, and you'll see the associated data, code, and forking history of that plot. If you select to view a grid
From the Chart Studio Workspace
Another way to get to your View Plot page is through the Chart Studio Workspace.
Click on your username on the top right-hand side and choose either the 'My Files' or 'Profile' menu from the drop-down.
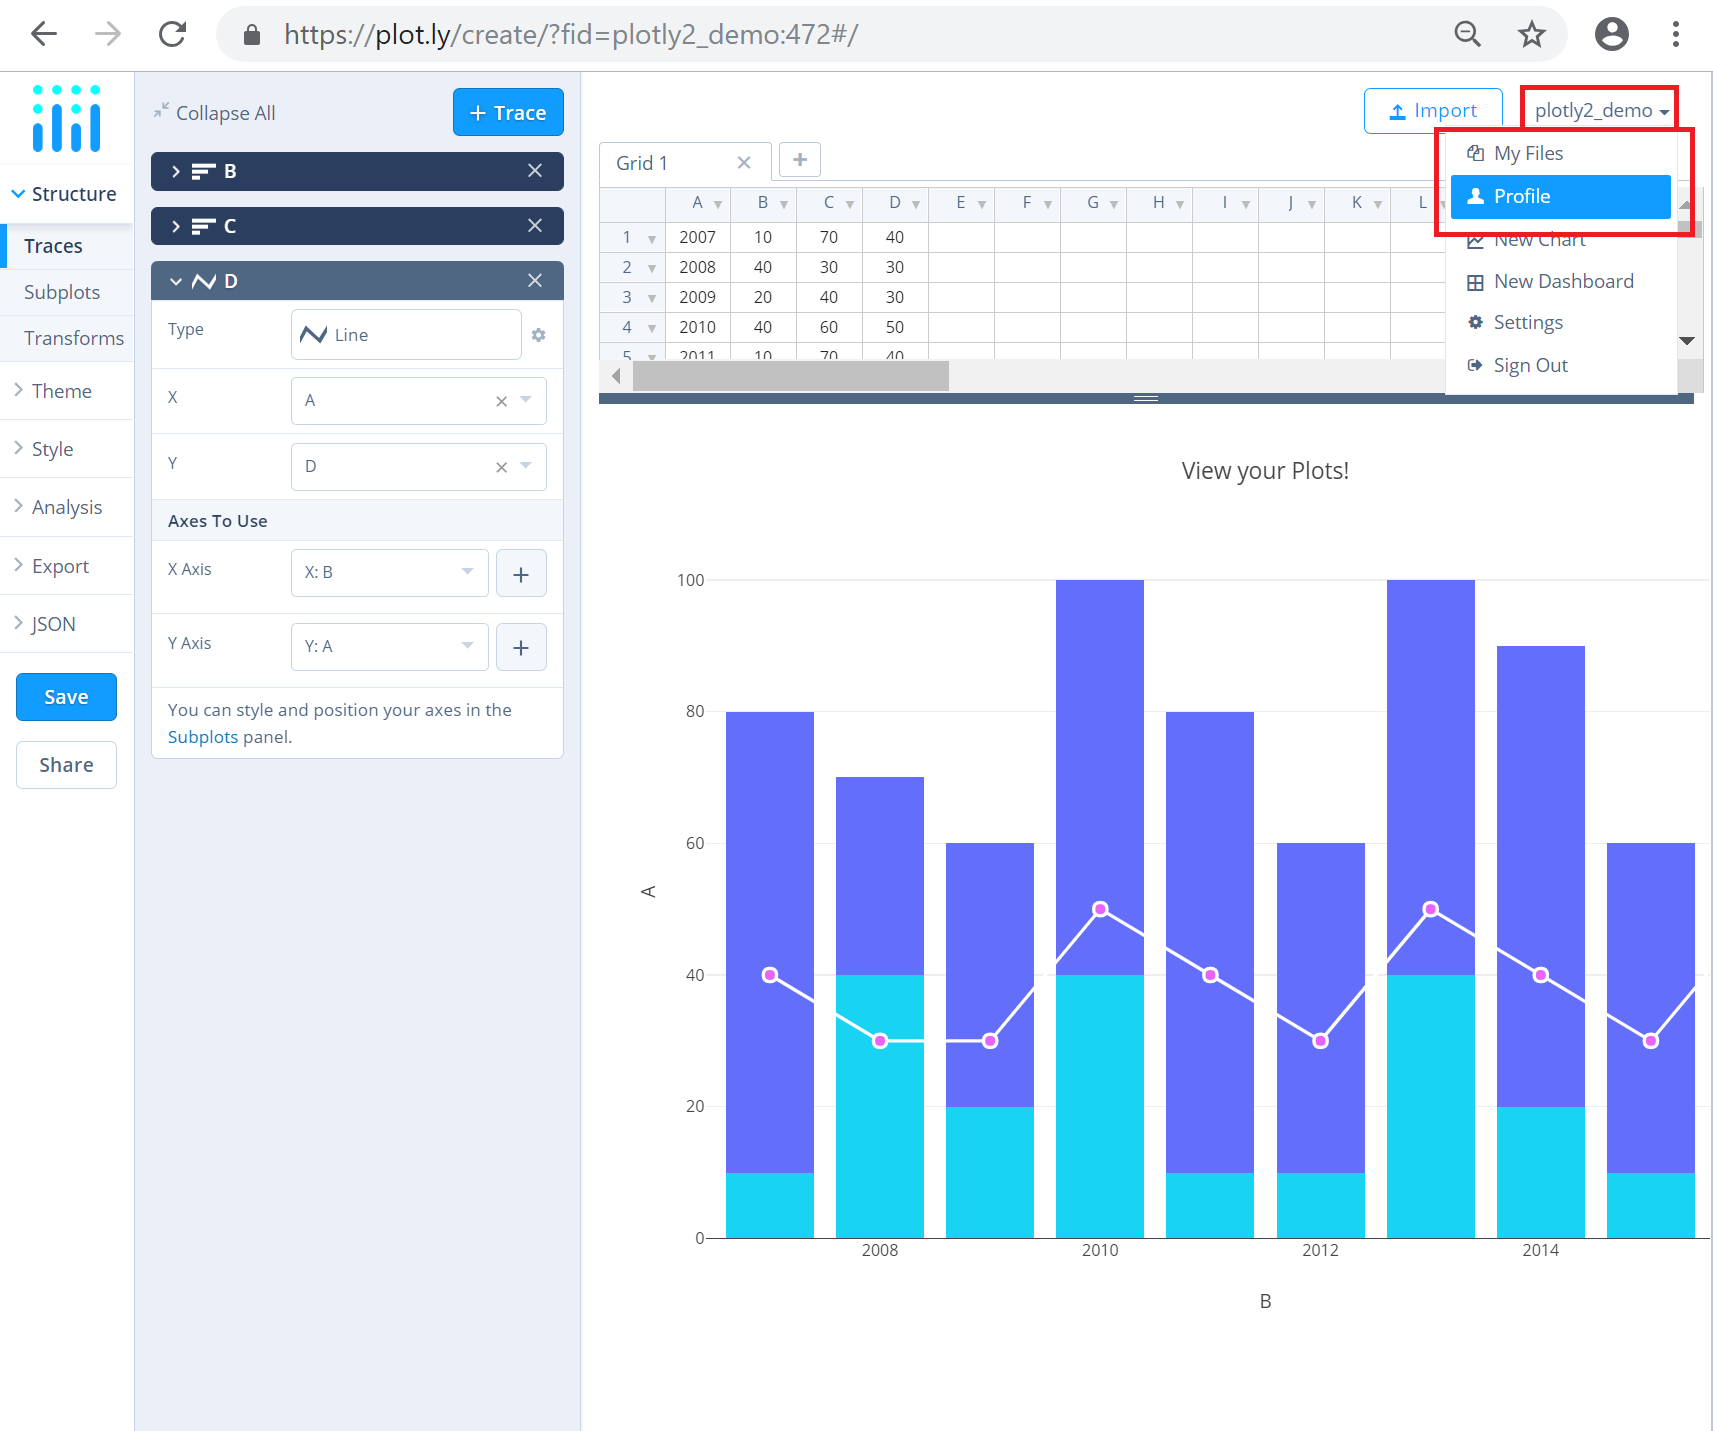
Both 'My Files' and 'Profile' pages are very similar, in the sense that you can see all the plots and grids that you've saved. Please notice your profile will only display plots that are public or shared with the viewer(s), but only you can view your 'Organize' page, and yor private plots.
From either of these pages, you can follow the same steps as above. Just hover over the thumbnail of your choice and click on 'View'.
From the Chart Studio Feed
The 'feed' page, similar to the workspace, is also featured on the Chart Studio homepage. You can click on the 'My Files' tab on the top to get to your 'organize' page.
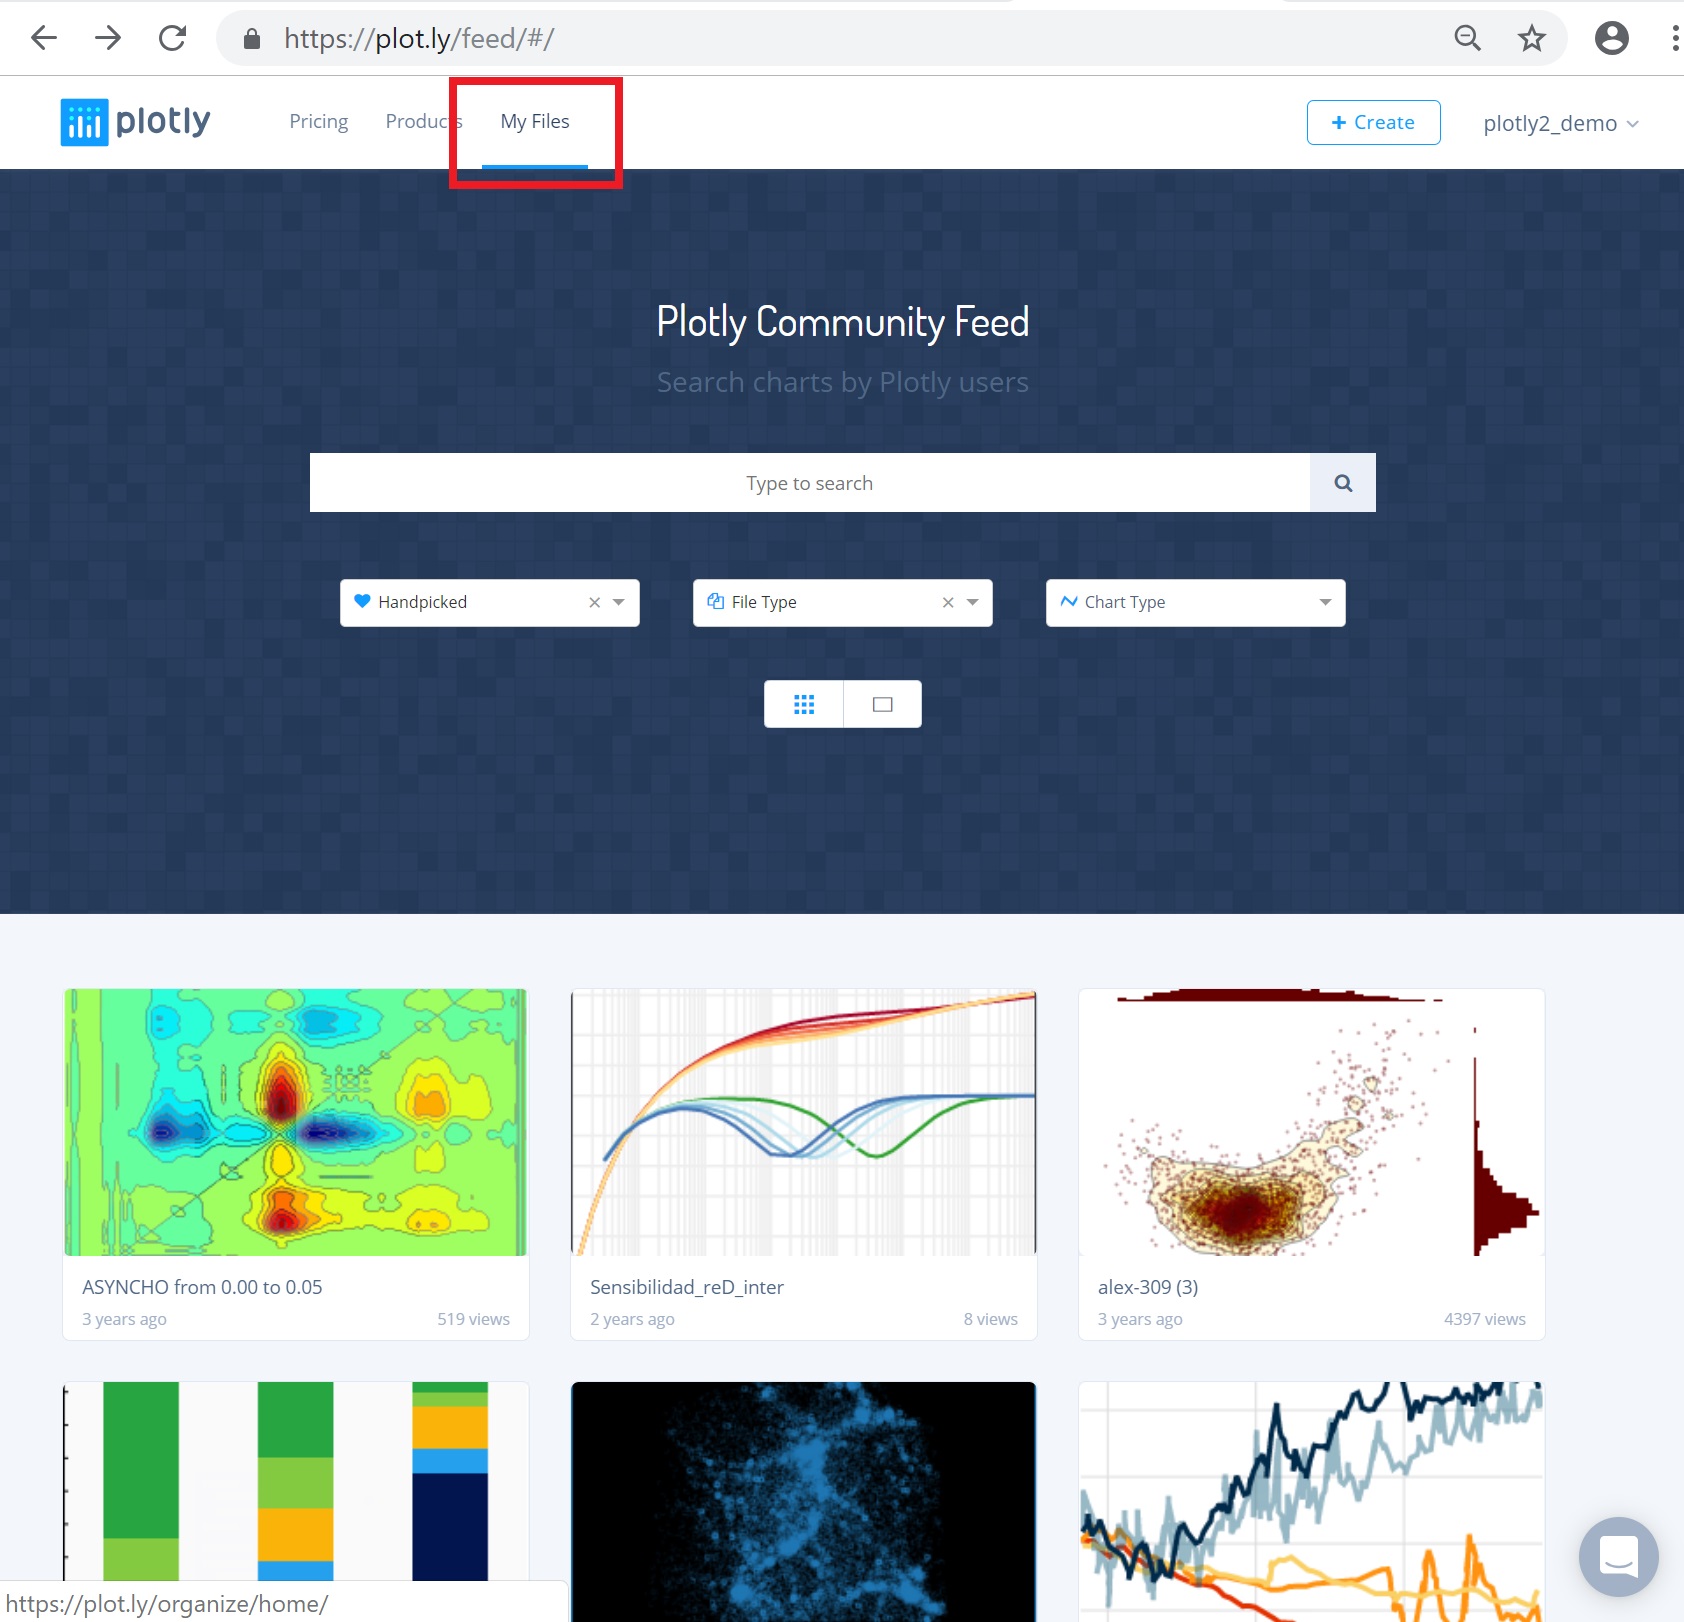
Or click on your username to select from the same dropdown menu as seen in the workspace.
The Chart Studio Feed page is where the users' plots are displayed for the public to see. Please note that only those plots that are saved as 'Public' will be displayed in this page.
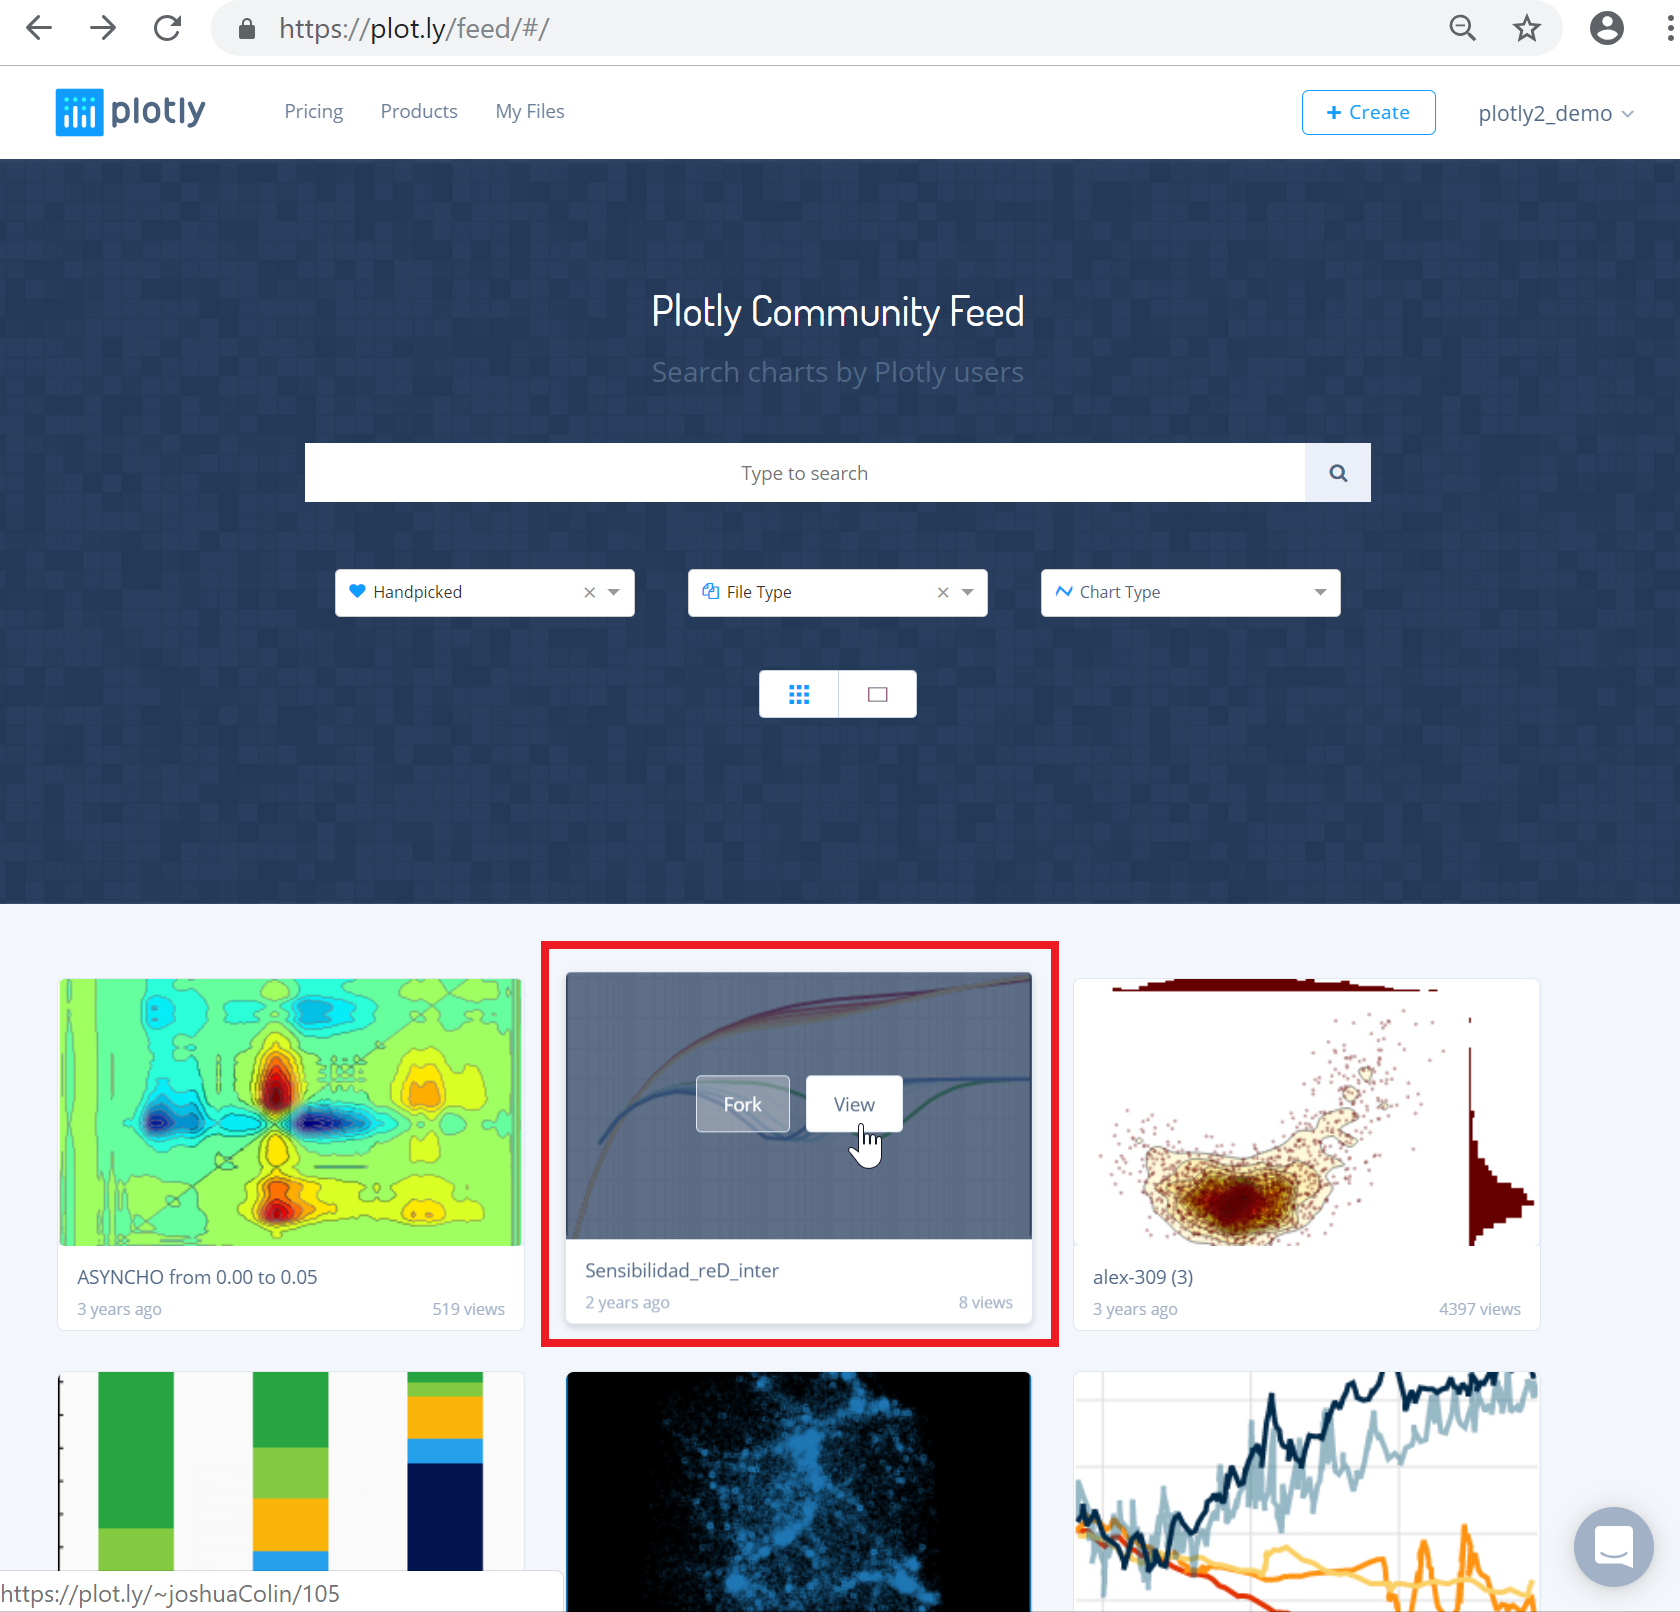
Hover over the plot you'd like to check out and click on the 'View' button. It'll direct you to the View Plot page of that plot.
