Create Charts Using Excel Data
How to make a plot from Excel in Chart Studio
Supported Files in Chart Studio
If you're comfortable with organizing, editing, and saving your data in an Excel spreadsheet or worksheet, Chart Studio has made it convenient for you to upload your own data files by accepting them in .xls, .xlsx, and .csv formats.
Import Your Data File
Head to Chart Studio Workspace and click on the 'Import' button next to your username in the top-right corner of the workspace.
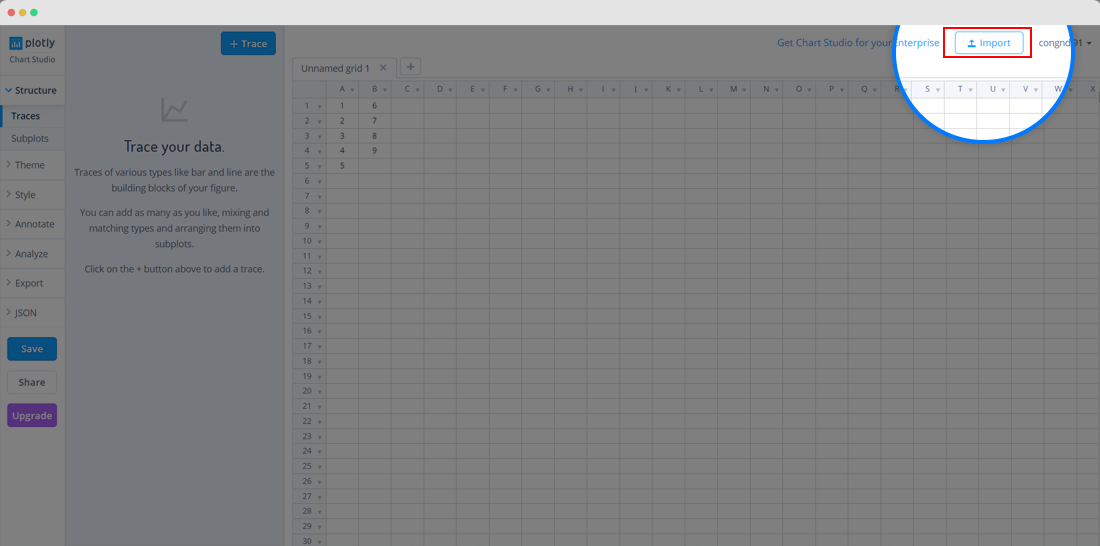
The 'Import' modal will appear, where you can upload your local data-file saved in the above mentioned format under the 'Upload' tab. You can either click the 'Upload' button or simply drag and drop the file into the window within the modal.
After uploading the file, the data will get imported into a new grid in the workspace.
Create Your Chart
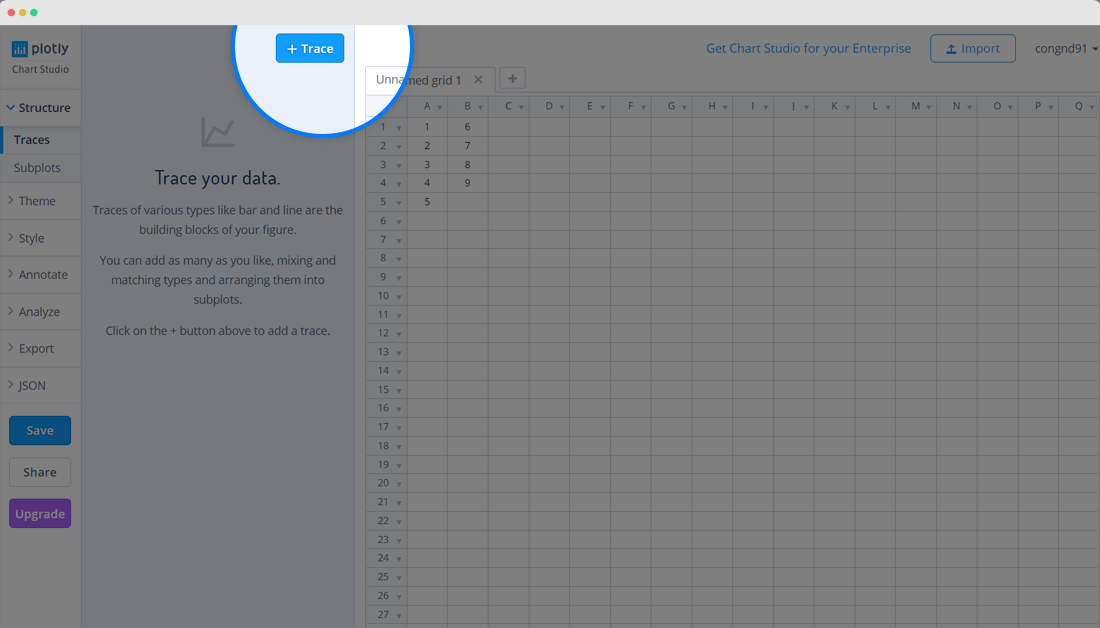
After adding data, go to the 'Traces' section under the 'Structure' menu on the left-hand side, then select the chart type of your choice under the attribute 'Type'. If you have a particular plot in mind but need help getting started, visit our Help page for more tutorials.
Save and Share
Once your chart is done, click the 'Save' button on the left-hand side. To learn more about saving, sharing, and exporting your work, visit this page.
Uploading your Excel file is just one way of adding your data to Chart Studio. For more information, including working with multiple data sets, see this tutorial!