Plotly JSON chart schema
Plotly JSON chart schema
Background
The Plotly JSON visualization schema is a complete declarative format for creating, saving, and sharing interactive, scientific charts. The advantage of saving charts as JSON is portability - charts can be shared across any language or platform that understands the schema.
The complete JSON schema is maintained as part of Plotly’s V2 REST API:
- Fully formatted JSON chart schema for every chart type: https://api.plot.ly/v2/plot-schema?sha1=%27%27
- Raw JSON (plain text) chart schema for every chart type: https://api.plot.ly/v2/plot-schema?format=json&sha1=%27%27
Translations of the JSON schema for practical use in several languages are also available:
- Python: https://plot.ly/python/reference/
- R: https://plot.ly/r/reference/
- MATLAB: https://plot.ly/matlab/reference/
- JavaScript: https://plot.ly/javascript/reference/
Demo: Online JSON Editor
Try updating the chart by editing its JSON specification in this online JSON editor.
A Simple Example
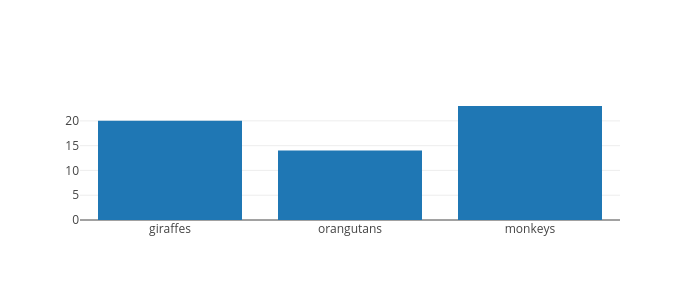
Below is a Plotly bar chart with the JSON specification that describes it.
Chart Image

JSON Descripton of Chart
{
    "data": [
        {
            "x": [
                "giraffes",
                "orangutans",
                "monkeys"
            ],
            "y": [
                20,
                14,
                23
            ],
            "type": "bar"
        }
    ]
}
More Examples
| Chart | JSON description |
|---|---|
| Area Chart | JSON |
| Pie Chart | JSON |
| Line Chart | JSON |
Cross-Language Translation
Using this JSON specification, it is easy to handle translation between different chart and data formats:
| Chart Translations | Link to Translation |
|---|---|
| Interactive chart | https://plot.ly/~PlotBot/880 |
| JSON specification | https://plot.ly/~PlotBot/880.json |
| Chart image | https://plot.ly/~PlotBot/880.png |
| Python code | https://plot.ly/~PlotBot/880.py |
| JavaScript code | https://plot.ly/~PlotBot/880.js |
| CSV download | https://plot.ly/~PlotBot/880.csv |
| Excel download | https://plot.ly/~PlotBot/880.xlsx |
Online JSON Editor
Try updating the chart by editing the JSON specification in this online JSON editor.

