How to Add an Inset in Chart Studio
Add an inset using the Chart Studio data visualization tool
Introduction
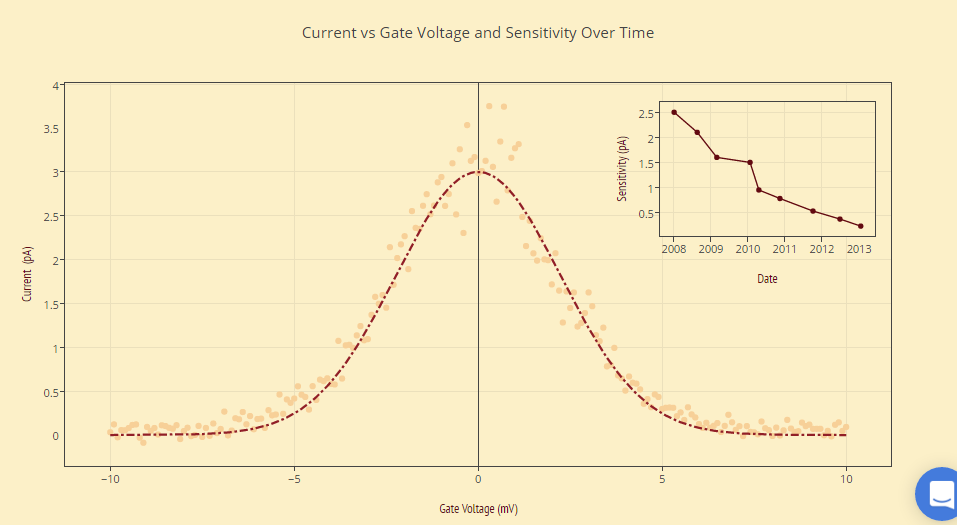
This feature allows you to add an inset plot to a main plot. This is great if you'd like to display related data, or highlight a portion of the main plot.
Add Your Data to Chart Studio
The first step is to head to Chart Studio’s new online workspace and add your data. It's also a good idea to name your columns beforehand (either by adding your data using Chart Studio, or naming them in the CSV or Excel file that you're uploading), and label your axes. This will make selections for a specific trace easier.
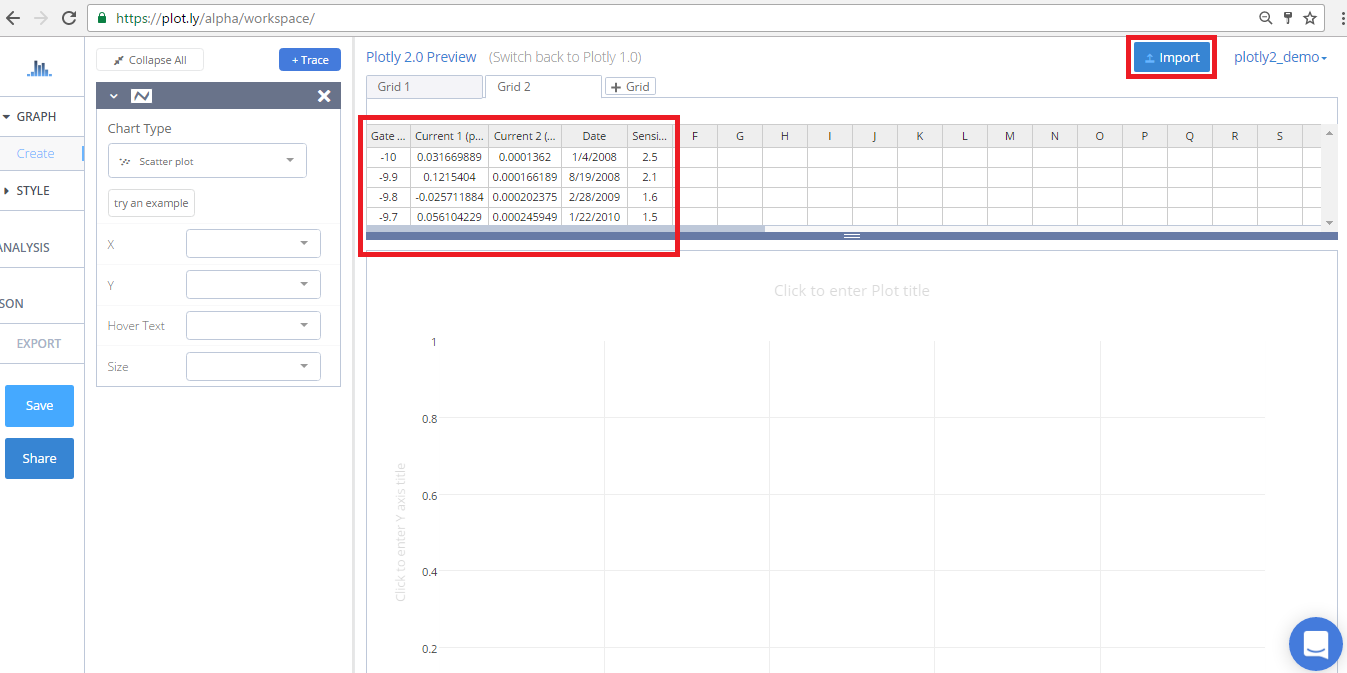
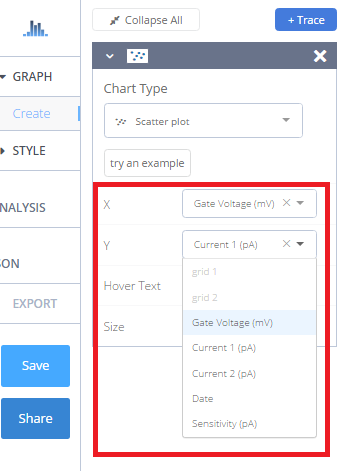
Create a Plot
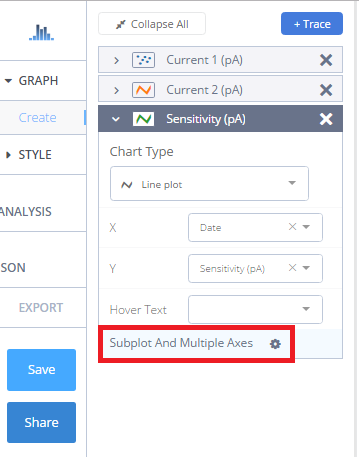
After adding your data, go to GRAPH on the left-hand side, then 'Create'. Choose your 'Chart type', and add your traces using the X and Y dropdown (this section is different depending on the chart type.
Select a Subplot
We need two traces in our main plot, so we'll repeat the above steps by clicking the blue '+Trace' button on the right-hand side of the panel to add the second trace.
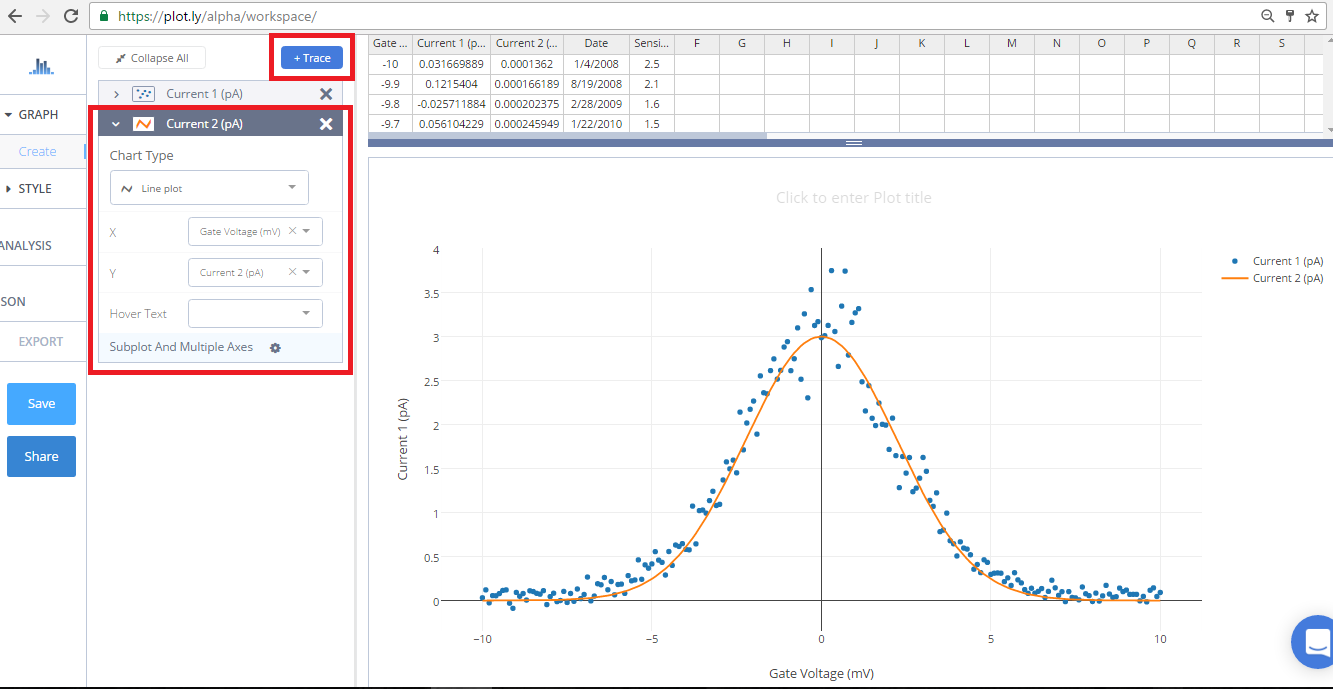
We'll do the same for our third trace, but after we select our x and y values, we'll click on 'Subplot and Multiple Axes'.
This will open a section where you can select an arrangement for your subplot.
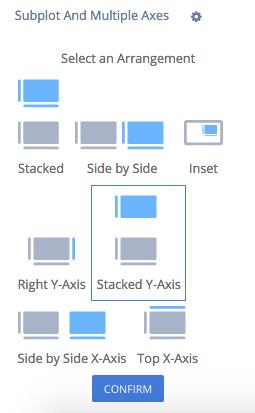
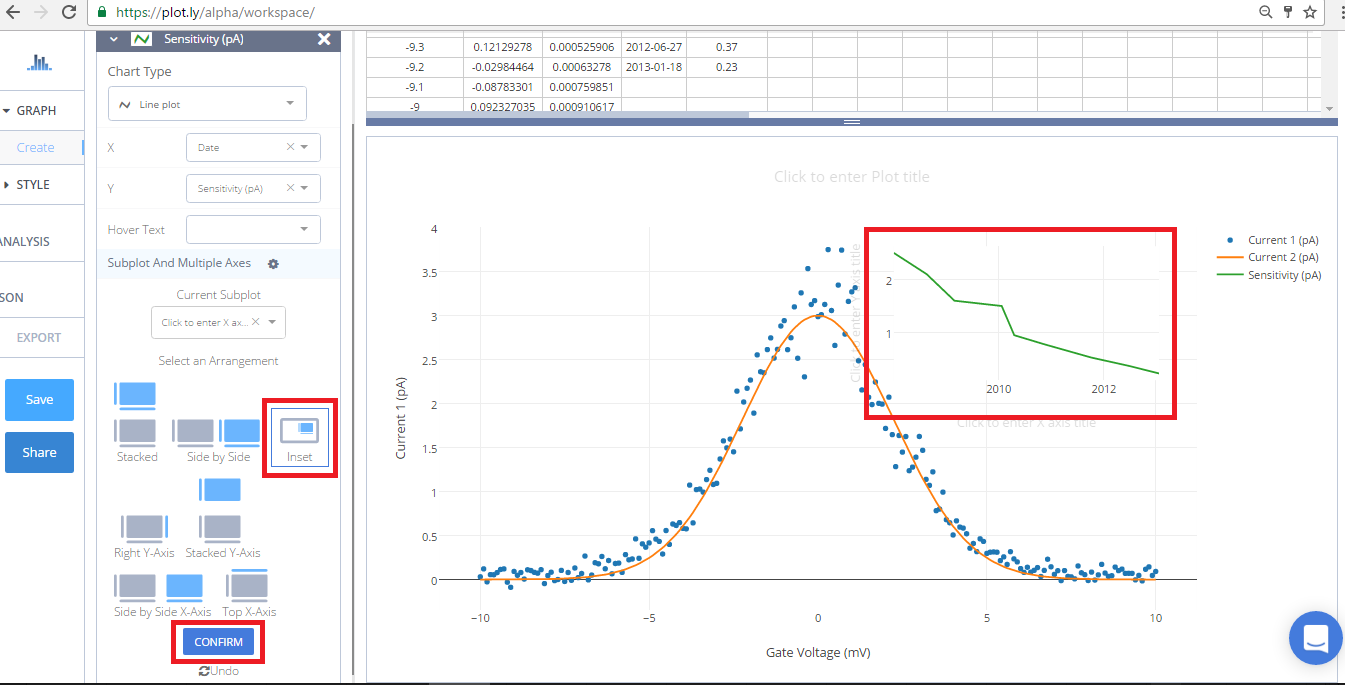
We'll select the 'Inset' arrangement for this trace, and click CONFIRM.
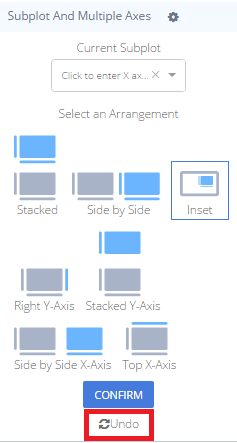
If you select an arrangement and then change your mind, the 'Undo' button will cancel the last arrangement selection only. This is very important to remember.
You can also add more than one inset. Just add another trace, click on the 'Subplot and Multiple Axes', and select the same 'Inset' arrangement. It's not necessary for our plot, so now we'll get to the fun part.
Style a Plot
We've styled this plot quite a bit, which includes adding lines around both plots, customizing our tick labels and markers, and playing with colors and typefaces.
If you like the way we've styled our plot, see this tutorial for more styling tips.
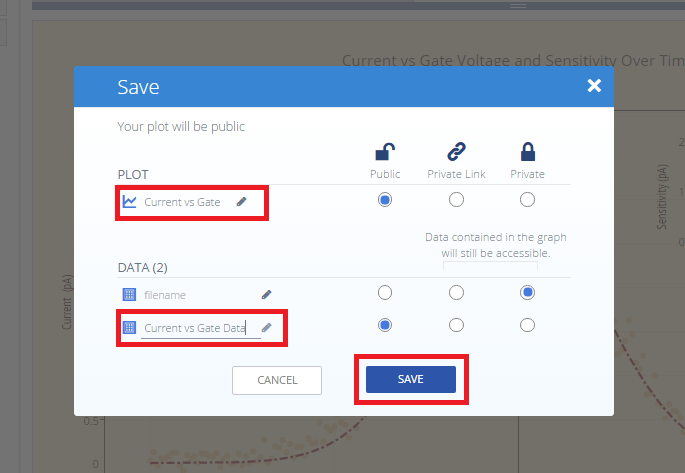
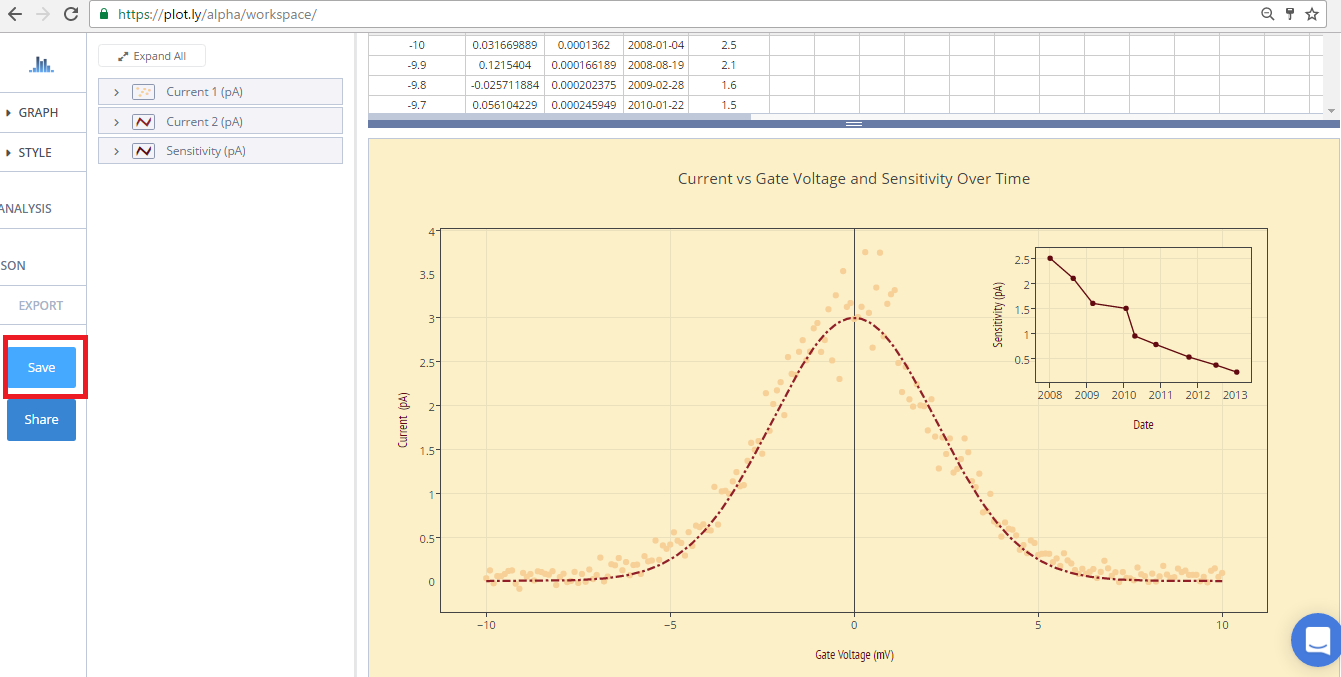
Save and Share
Your plot is now done! Click SAVE on the left-hand side.
Give your PLOT and DATA a filename and select the privacy setting. For more information on how sharing works, including the difference between private, public, and secret sharing, visit this page.