An Introduction to Chart Studio Modebar
At the top of every two-dimensional Chart Studio plot you will find icons with the following functions. For 3d plots see below:
Download Plot as a PNG
| As it is shown in the picture, click on the camera icon and get the plot in PNG format. |
 |
Clicking and holding with your mouse allows you to zoom and pan. You can toggle between modes by clicking on the zoom or pan icons.
| Clicking this selects the Zoom mode. To zoom in on a region of a Chart Studio graph, click and hold your mouse, moving across the region. Release your mouse. To return to the original view, double-click anywhere on the plot. |
 |
| To pan across regions of your graph, select the Pan mode. Click and hold your mouse to explore the data. Double-click anywhere to return to the original view. |
 |
Zoom In/Out
You can zoom in and out by clicking on the + and - buttons. Chart Studio keeps axes labels and annotations the same size to preserve readability. Your axes labels will automatically optimize as you zoom in.
Autoscale and Reset Axes
When a graph is made using Chart Studio, we guess how the graph axes should be set. This is called “autoscale”. Sometimes our guess isn’t exactly what the graph creator wants. When a graph is made, the user can change the axes, and then save their graph. You can return to this saved form by clicking on Reset Axes.
| Clicking this zooms to include your Axes Range, if this has been set. If it has not been set it zooms to a setting that is optimized to include all the viewable data, the same as if Autoscale had been clicked. |
 |
| Clicking Autoscale zooms the plot back to a setting that is optimized to include all the viewable data regardless of the Axes Range setting. |
 |
Hover Options
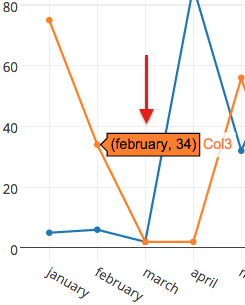
One of these two buttons is selected at all times. Clicking ‘Show closest data on hover’ will display the data for just the one point under the cursor.
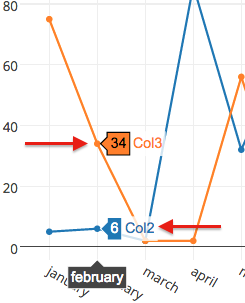
Clicking ‘Compare data on hover’ will show you the data for all points with the same x-value.
3D Charts
| The mode bar for 3D charts gives you additional options for controlling rotations and also lets you toggle between the default view, and your last saved view. |
 |
| ‘Orbital Rotation’ rotates the plot around its middle point in three-dimensional space. |
 |
| ‘Turntable Rotation’ rotates the plot around its middle point while constraining one axis slightly. |
 |
| Clicking ‘Reset Camera’ to Default zooms back to the default position at 45 degrees from all axes. |
 |
| Clicking ‘Reset Camera’ to Last Save zooms it to the last saved position as set in the Organize view. |
 |