Links, Text, and HTML in Graphs
How to insert link, text and HTML in graphs
Links, Text, and HTML in Graphs
Want to add a link to the data source on one of your graphs? Need superscripts or subscripts in your title? Chart Studio supports several HTML tags and codes for special characters, like Greek letters. In this tutorial we’ll show you the basics of integrating these features with Chart Studio. Looking for even more formatting options? LaTeX offers additional flexibility. Check out our tutorial here. Chart Studio uses a subset of HTML tags to do things like newline (<br>), bold (<b></b>), italics (<i></i>), and hyperlinks (<a href=’…’></a>). Tags <em>, <sup>, and <sub> are also supported. Follow along below for some examples.
Step 1: Using HTML with Chart Studio
For this tutorial, we’ll examine some of the styling from the graph: https://plot.ly/609/~Dreamshot/. If you want to edit the graph yourself, you can click the link above.
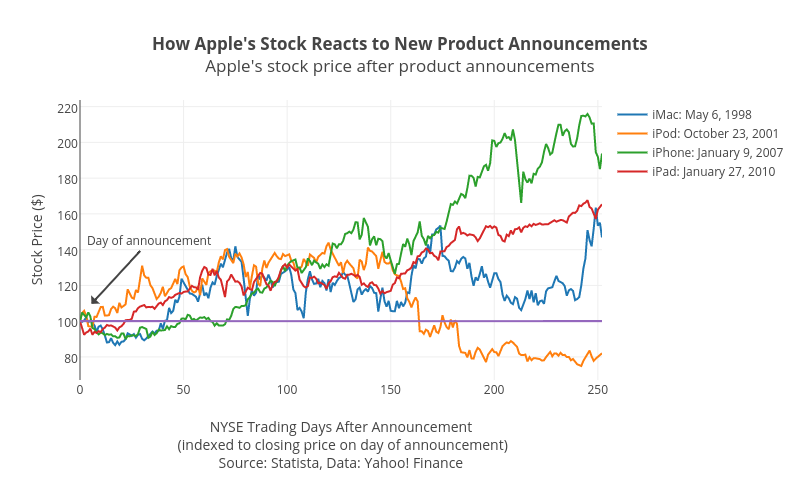
| The title of this graph has two features: it’s on two lines, and the first line is bolded. To create the line break, all we have to do is enter <br> where we want the break to appear: How Apple’s Stock Reacts to New Product Announcements <br> Apple’s stock price after product announcements (indexed to closing price on the day of the announcement) | 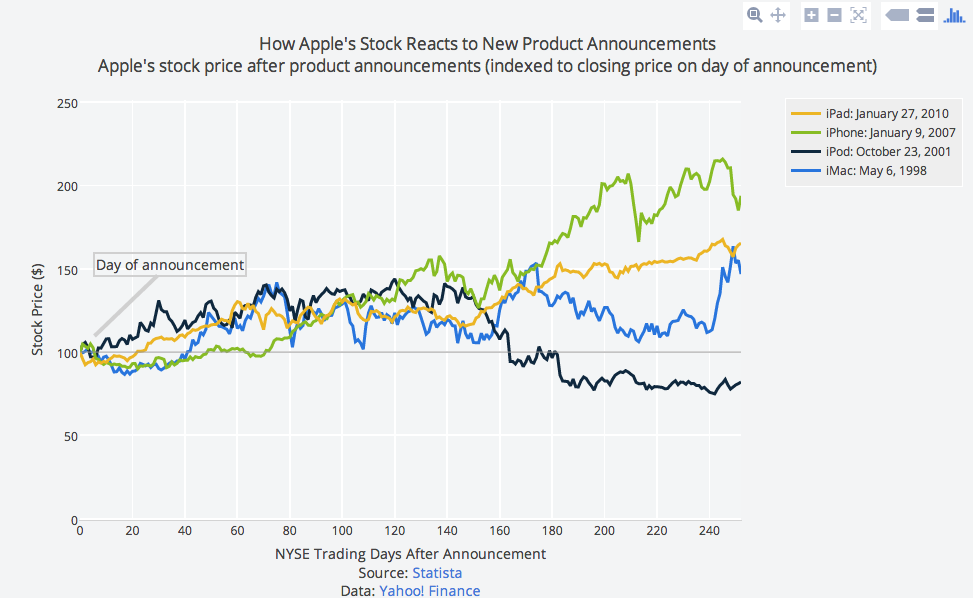 Graph title after adding a line break Graph title after adding a line break |
| To add bold text, we enclose the text with <b>…</b>: <b>How Apple’s Stock Reacts to New Product Announcements</b><br> Apple’s stock price after product announcements (indexed to closing price on the day of the announcement) | 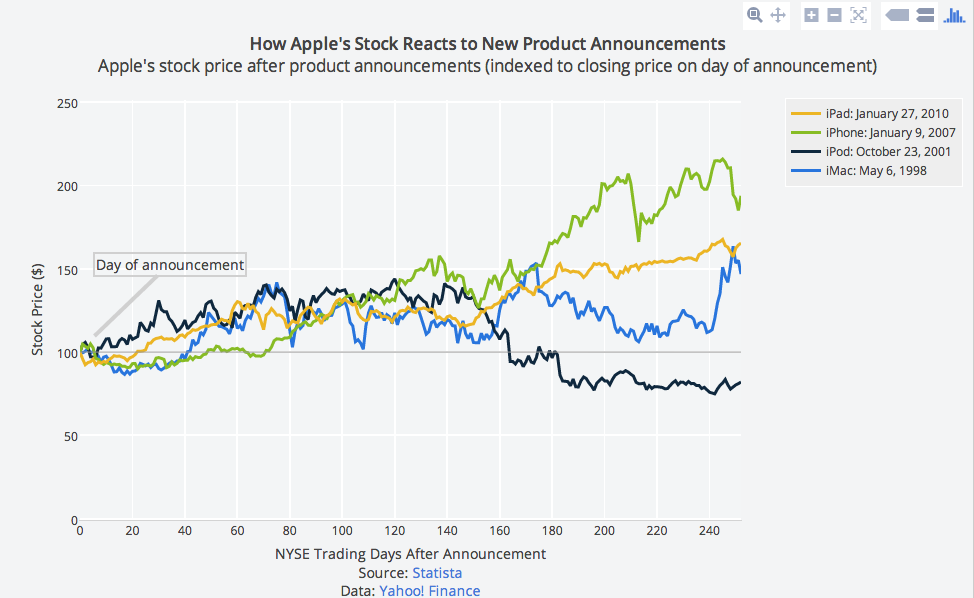 Graph title after adding bold tags. Graph title after adding bold tags. |
| The sources at the bottom of the graph contain hyperlinks so that the reader has a direct link to the source. This source link is added to the x axis label of the graph. The line that says “Source: “ Statista” is written as: Source: <a href=”http://www.statista.com/chart/2684/apple-stock-price-after-product-announcements/”>Statista</a> | 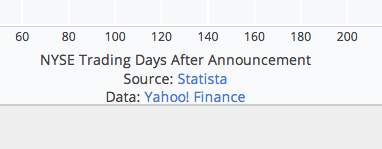 x axis label with source links. x axis label with source links. |
| The source link above was added to the x axis label of the graph, but you can also place a source link anywhere on the graph by adding an annotation. A popular place to position source links using annotations is in the bottom-right of the graph. To add an annotation, click on NOTES in the toolbar, then click on the “+”. You can drag the note and arrow to place it as you like. | 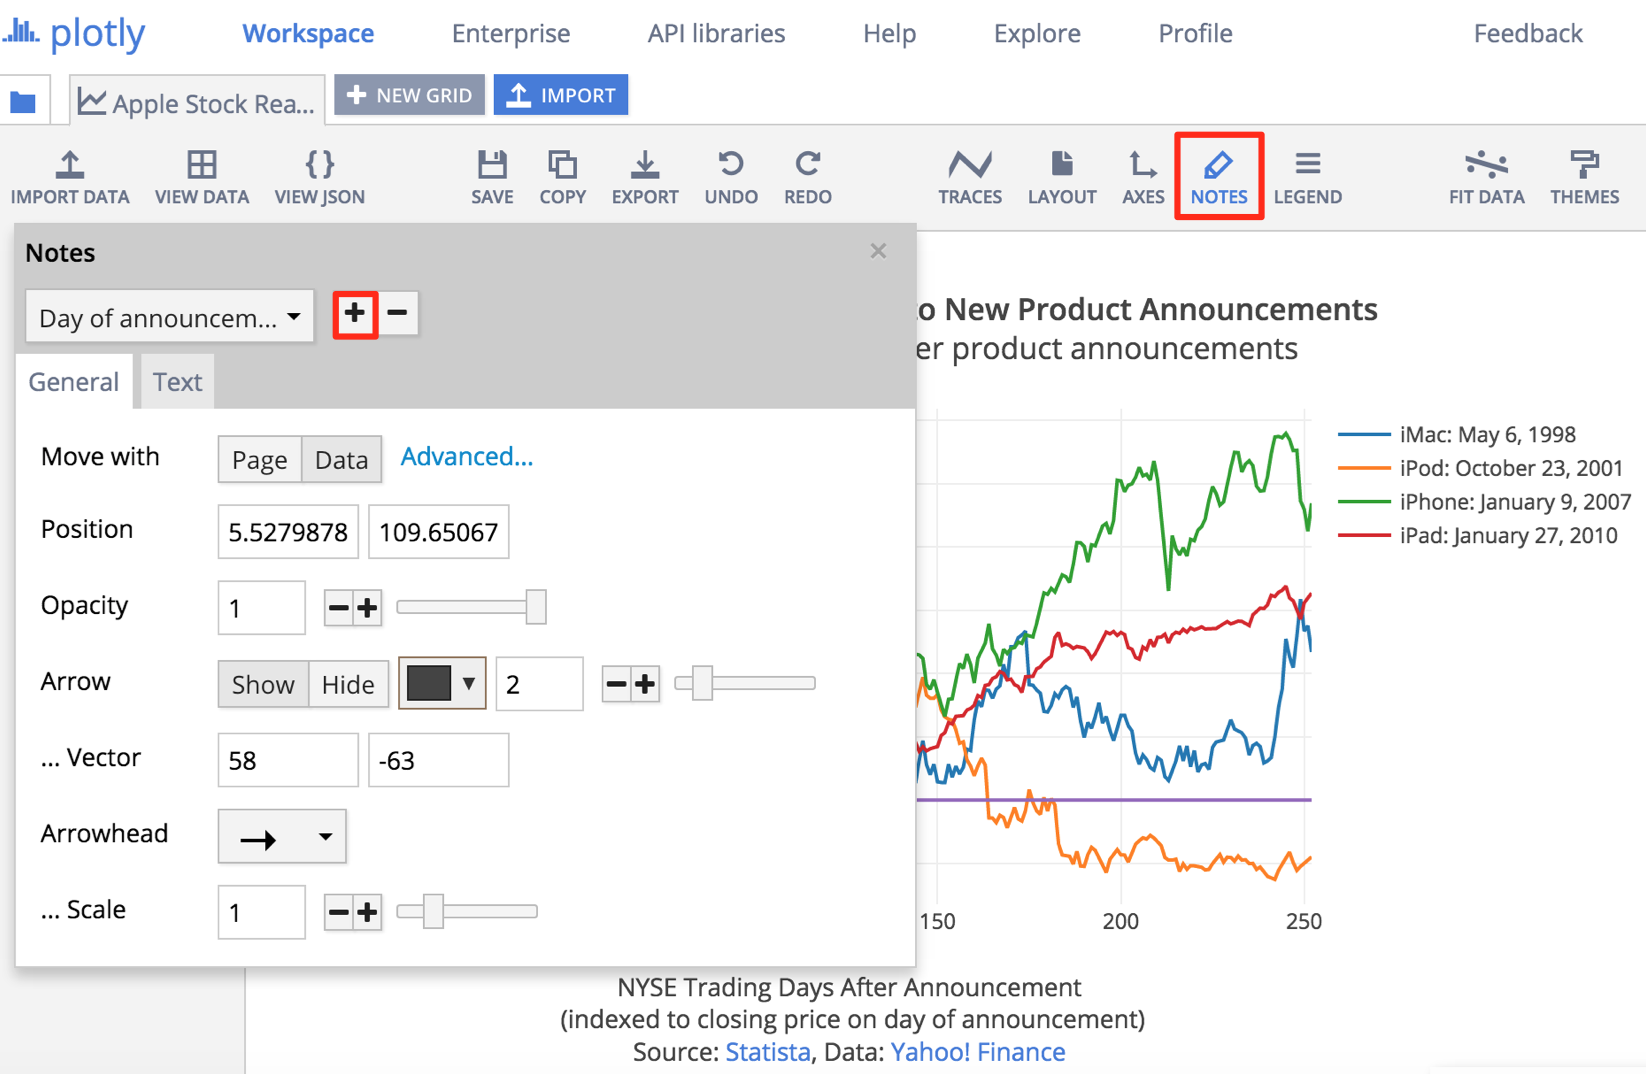 |
Step 2: The essentials
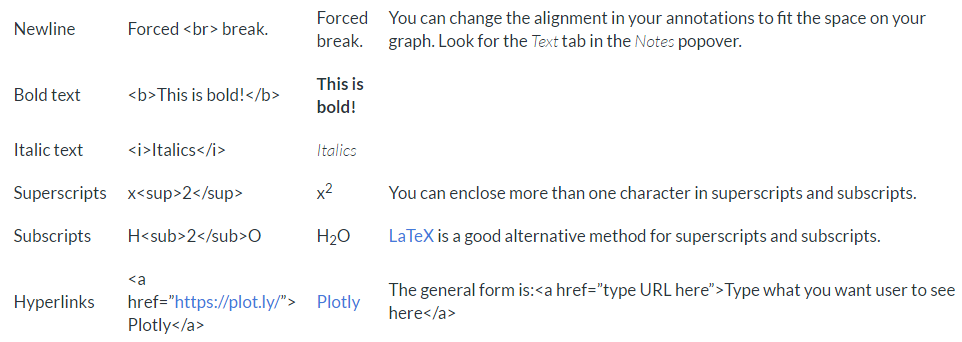
| Type | Code | What you'll see | Hints |
| Newline | Forced <br> break. | Forced break. | You can change the alignment in your annotations to fit the space on your graph. Look for the Text tab in the Notes popover. |
| Bold text | <b>This is bold!</b> | This is bold! | |
| Italic text | <i>Italics</i> | Italics | |
| Superscripts | x<sup>2</sup> | x2 | You can enclose more than one character in superscripts and subscripts. |
| Subscripts | H<sub>2</sub>O | H2O | LaTeX is a good alternative method for superscripts and subscripts. |
| Hyperlinks | <a href=”https://plot.ly/”> Chart Studio</a> | Chart Studio | The general form is:<a href=”type URL here”>Type what you want user to see here</a> |
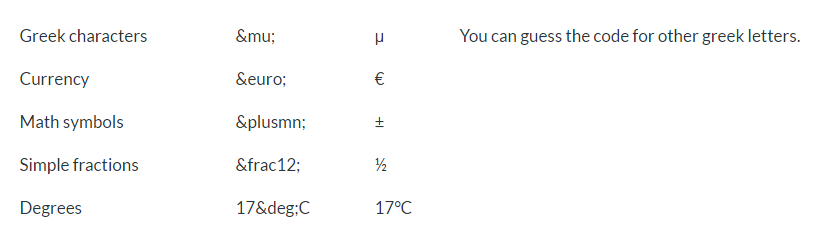
You can also add characters to your titles and annotation with HTML entities. Here are a few you might find useful. You can find the full collection here.
| Type | Code | What you'll see | Hints |
| Greek characters | μ | μ | You can guess the code for other greek letters. |
| Currency | € | € | |
| Math symbols | ± | ± | |
| Simple fractions | ½ | ½ | |
| Degrees | 17°C | 17°C |