Edit chart
Loading graph
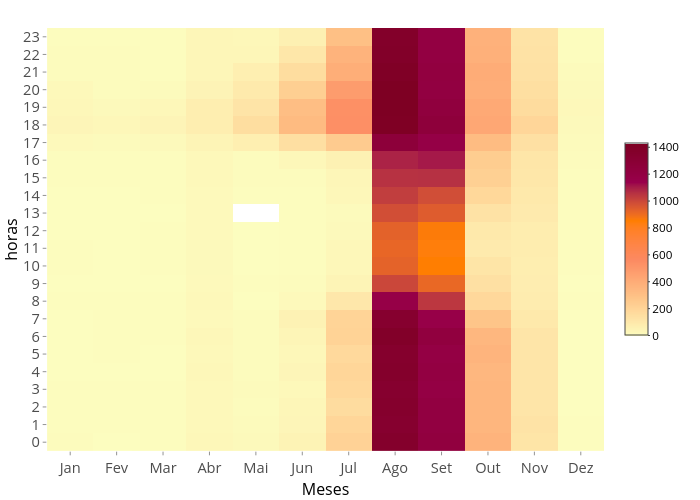
Willianflores's interactive graph and data of "horas vs Meses" is a heatmap, showing 99_e5e5daedf273f963eb9d4f36cf52dc38; with Meses in the x-axis and horas in the y-axis.. The x-axis shows values from 0.5 to 12.5. The y-axis shows values from -0.5 to 23.5.