Edit chart
Loading graph
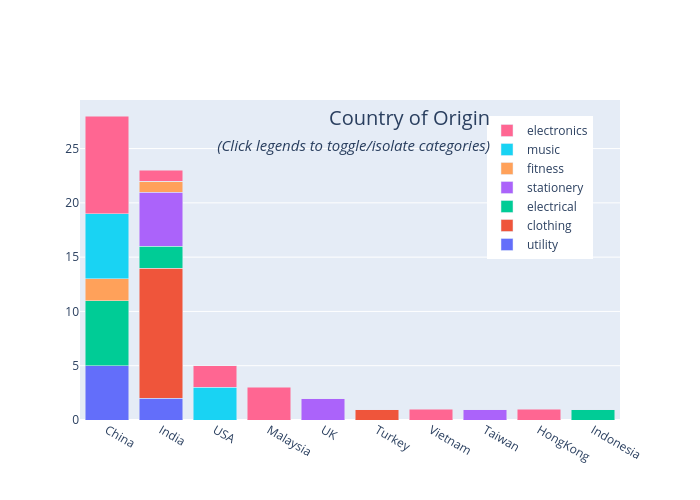
Vipul's interactive graph and data of "Country of Origin(Click legends to toggle/isolate categories)" is a stacked bar chart, showing utility, clothing, electrical, stationery, fitness, music, electronics. The x-axis shows values from 0 to 0. The y-axis shows values from 0 to 0.