Edit chart
Loading graph
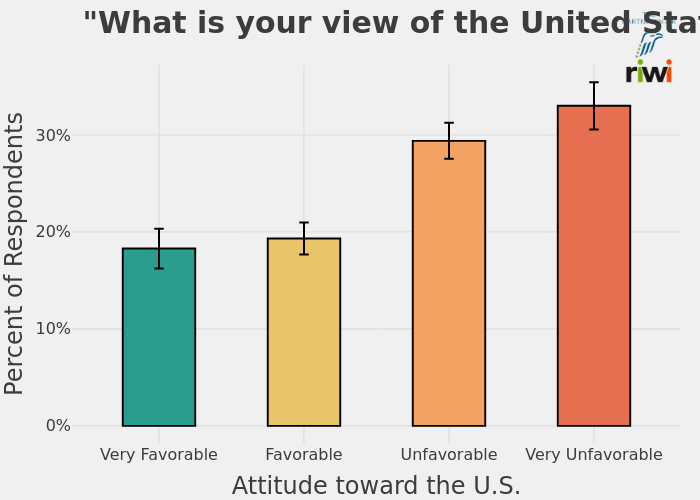
Uscnpm's interactive graph and data of " "What is your view of the United States?" " is a , showing Very Favorable, Favorable, Unfavorable, Very Unfavorable, Very Favorable, Favorable, Unfavorable, Very Unfavorable; with Attitude toward the U.S. in the x-axis and Percent of Respondents in the y-axis.. The x-axis shows values from 0.4 to 4.6. The y-axis shows values from -0.0177203138998781 to 0.37212659189744.