Edit chart
Loading graph
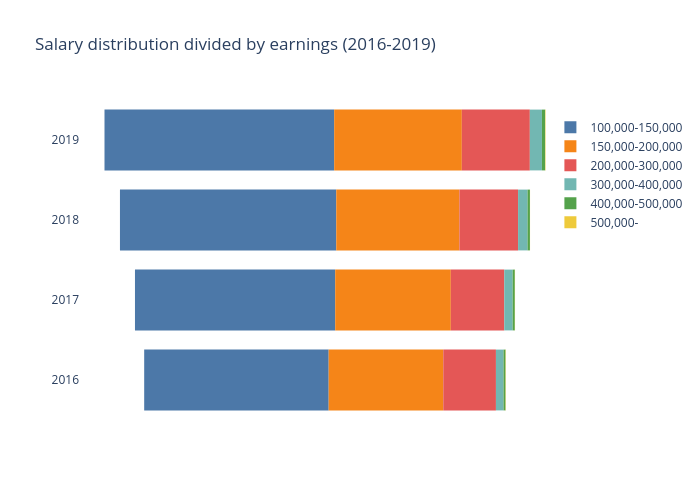
Thevarsity-news's interactive graph and data of "Salary distribution divided by earnings (2016-2019)" is a funnel, showing 100,000-150,000, 150,000-200,000, 200,000-300,000, 300,000-400,000, 400,000-500,000, 500,000-; with no. of U of T faculty and staff on the Sunshine List in the x-axis. The x-axis shows values from -2456.6666666666665 to 2456.6666666666665. The y-axis shows values from 2015.5 to 2019.5.