Edit chart
Loading graph
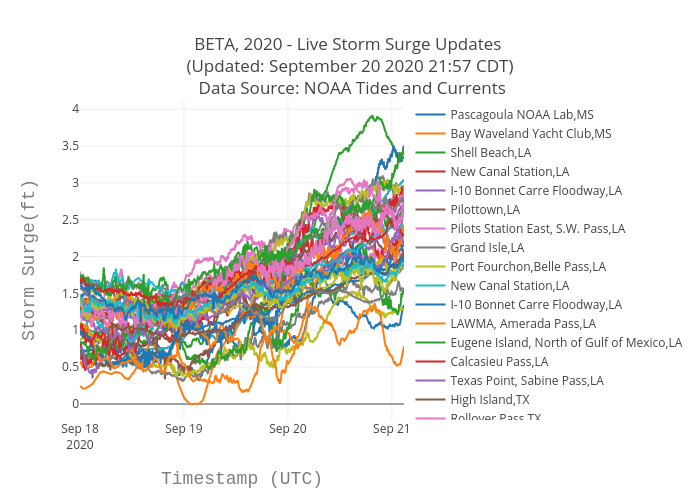
Srcc2020's interactive graph and data of "BETA, 2020 - Live Storm Surge Updates (Updated: September 29 2020 11:00 CDT) Data Source: NOAA Tides and Currents" is a scatter chart, showing Pascagoula NOAA Lab,MS, Bay Waveland Yacht Club,MS, Shell Beach,LA, New Canal Station,LA, I-10 Bonnet Carre Floodway,LA, Pilottown,LA, Pilots Station East, S.W. Pass,LA, Grand Isle,LA, Port Fourchon,Belle Pass,LA, New Canal Station,LA, I-10 Bonnet Carre Floodway,LA, LAWMA, Amerada Pass,LA, Eugene Island, North of Gulf of Mexico,LA, Calcasieu Pass,LA, Texas Point, Sabine Pass,LA, High Island,TX, Rollover Pass,TX, Galveston Bay Entrance, North Jetty,TX, Galveston Pier 21,TX, Eagle Point, Galveston Bay,TX, Morgans Point,TX, Manchester,TX, San Luis Pass,TX, Freeport SPIP, Freeport Harbor,TX, Sargent,TX, Matagorda City,TX, Matagorda Bay Entrance Channel,TX, Port O’Connor,TX, Seadrift,TX, Aransas Wildlife Refuge,TX, Rockport,TX, Aransas, Aransas Pass,TX, Port Aransas,TX, USS Lexington, Corpus Christi Bay,TX, Nueces Bay,TX, Packery Channel,TX, Bob Hall Pier, Corpus Christi,TX, Realitos Peninsula,TX, SPI Brazos Santiago,TX, South Padre Island CG Station,TX, Port Isabel,TX; with Timestamp (UTC) in the x-axis and Storm Surge(ft) in the y-axis.. The x-axis shows values from 0 to 0. The y-axis shows values from 0 to 0.