Edit chart
Loading graph
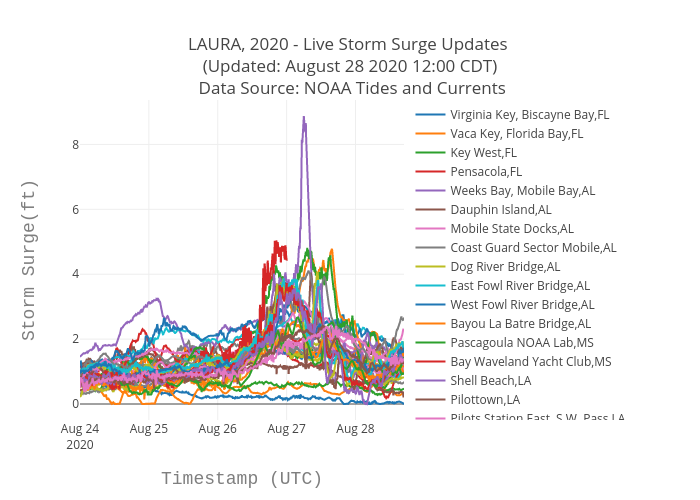
Srcc2020's interactive graph and data of "LAURA, 2020 - Live Storm Surge Updates (Updated: August 28 2020 12:00 CDT) Data Source: NOAA Tides and Currents" is a scatter chart, showing Virginia Key, Biscayne Bay,FL, Vaca Key, Florida Bay,FL, Key West,FL, Pensacola,FL, Weeks Bay, Mobile Bay,AL, Dauphin Island,AL, Mobile State Docks,AL, Coast Guard Sector Mobile,AL, Dog River Bridge,AL, East Fowl River Bridge,AL, West Fowl River Bridge,AL, Bayou La Batre Bridge,AL, Pascagoula NOAA Lab,MS, Bay Waveland Yacht Club,MS, Shell Beach,LA, Pilottown,LA, Pilots Station East, S.W. Pass,LA, Grand Isle,LA, Port Fourchon, Belle Pass,LA, New Canal Station,LA, I-10 Bonnet Carre Floodway,LA, LAWMA, Amerada Pass,LA, Eugene Island, North of Gulf of Mexico,LA, Freshwater Canal Locks,LA, Calcasieu Pass,LA, Texas Point, Sabine Pass,LA, High Island,TX, Rollover Pass,TX, Galveston Bay Entrance, North Jetty,TX, Galveston Pier 21,TX, Eagle Point, Galveston Bay,TX, Morgans Point,TX, Manchester,TX, San Luis Pass,TX, Freeport SPIP, Freeport Harbor,TX, Sargent,TX, Matagorda City,TX; with Timestamp (UTC) in the x-axis and Storm Surge(ft) in the y-axis.. The x-axis shows values from 0 to 0. The y-axis shows values from 0 to 0.