Edit chart
Loading graph
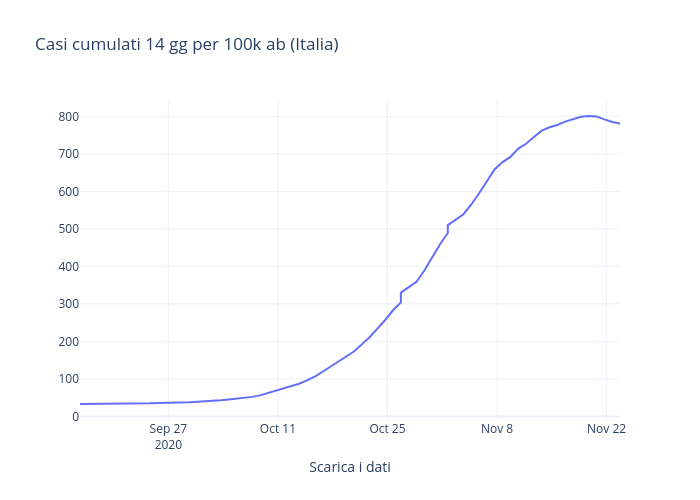
Scienzainrete's interactive graph and data of "Casi cumulati 14 gg per 100k ab (Italia)" is a line chart; with Scarica i dati in the x-axis. The x-axis shows values from 2020-09-15 17:00 to 2020-11-23 17:00. The y-axis shows values from -9.666666666666657 to 843.6666666666666.