Edit chart
Loading graph
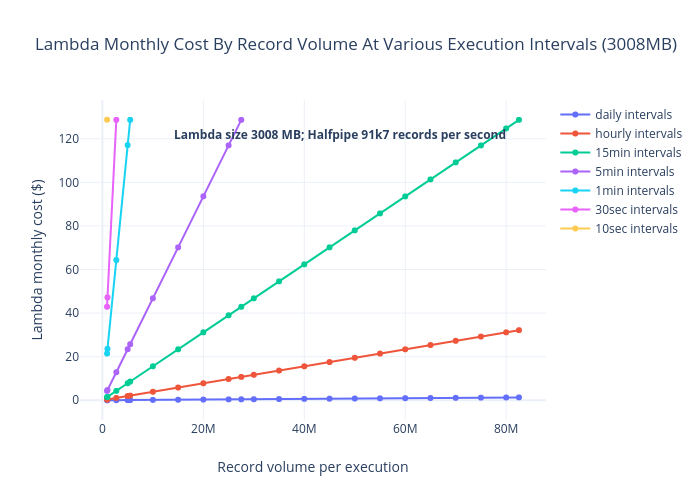
Relloyd's interactive graph and data of "Lambda Monthly Cost By Record Volume At Various Execution Intervals (3008MB)" is a , showing daily intervals, hourly intervals, 15min intervals, 5min intervals, 1min intervals, 30sec intervals, 10sec intervals; with Record volume per execution in the x-axis and Lambda monthly cost ($) in the y-axis.. The x-axis shows values from -3858228.7234042548 to 87305228.72340426. The y-axis shows values from -8.05494884910486 to 136.78494884910486. This visualization has the following annotation: Lambda size 3008 MB; Halfpipe 91k7 records per second