Edit chart
Loading graph
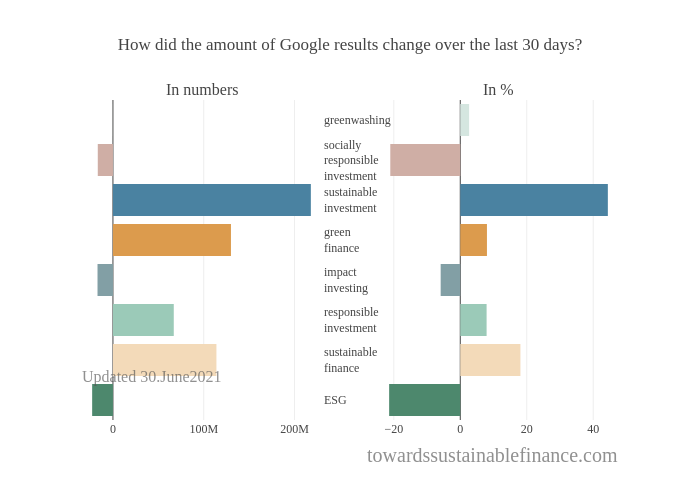
Philippschmalen's interactive graph and data of "How did the amount of Google results change over the last 30 days?" is a bar chart. The x-axis shows values from 0 to 0. The y-axis shows values from 0 to 0. This visualization has the following annotations: In numbers; In %