Edit chart
Loading graph
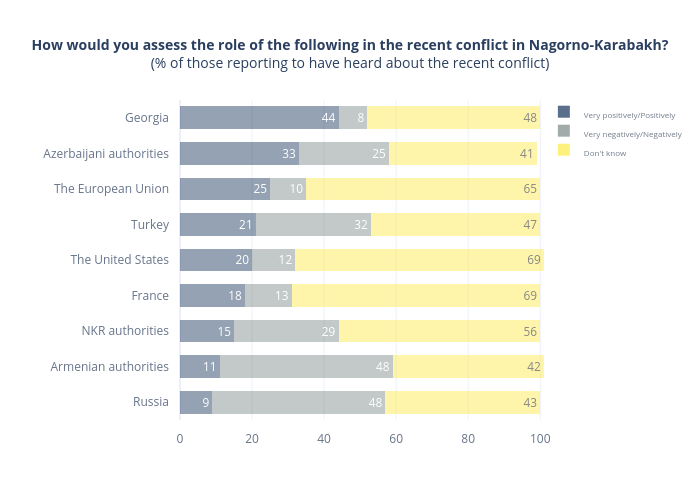
Ninozubashvili's interactive graph and data of "How would you assess the role of the following in the recent conflict in Nagorno-Karabakh?(% of those reporting to have heard about the recent conflict)" is a stacked bar chart, showing Very positively/Positively, Very negatively/Negatively, Don't know; with in the y-axis. The x-axis shows values from 0 to 106.3157894736842. The y-axis shows values from -0.5 to 8.5.