Edit chart
Loading graph
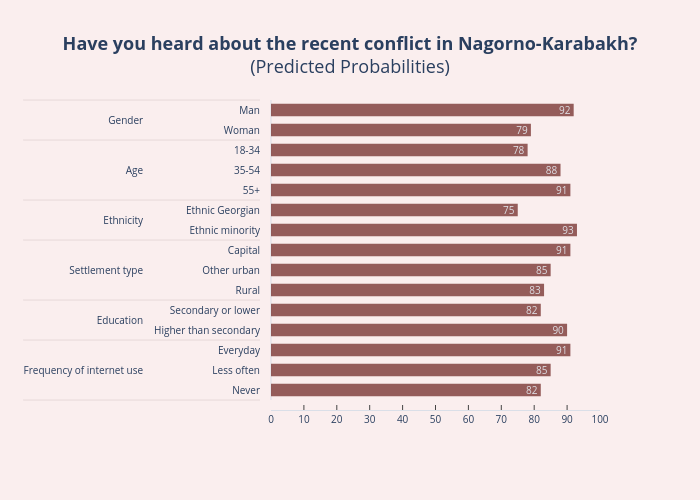
Ninozubashvili's interactive graph and data of "Have you heard about the recent conflict in Nagorno-Karabakh?(Predicted Probabilities)" is a bar chart. The x-axis shows values from 0 to 100. The y-axis shows values from -0.5 to 14.5.