Edit chart
Loading graph
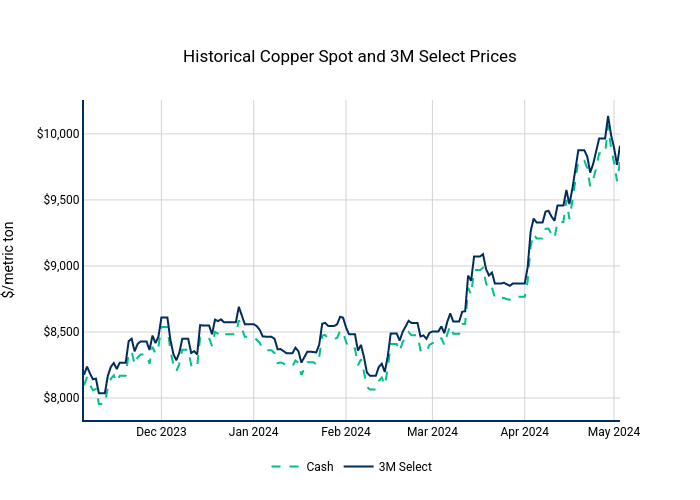
Nhillman_aegis2's interactive graph and data of "Historical Copper Spot and 3M Select Prices" is a line chart, showing Cash vs 3M Select; with $/metric ton in the y-axis. The x-axis shows values from 2023-11-12 to 2024-05-10. The y-axis shows values from 0 to 0. This visualization has the following annotations: $9,897.52; $10,004.00