Edit chart
Loading graph
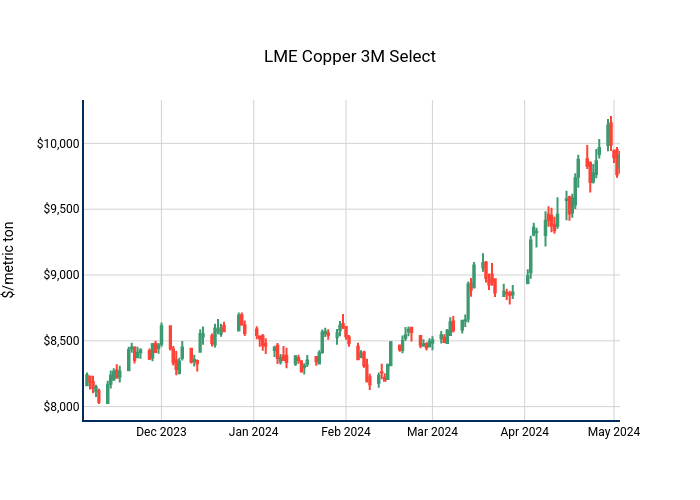
Nhillman_aegis2's interactive graph and data of "LME Copper 3M Select" is a candlestick; with $/metric ton in the y-axis. The x-axis shows values from 2023-11-12 to 2024-05-10. The y-axis shows values from 0 to 0.