Edit chart
Loading graph
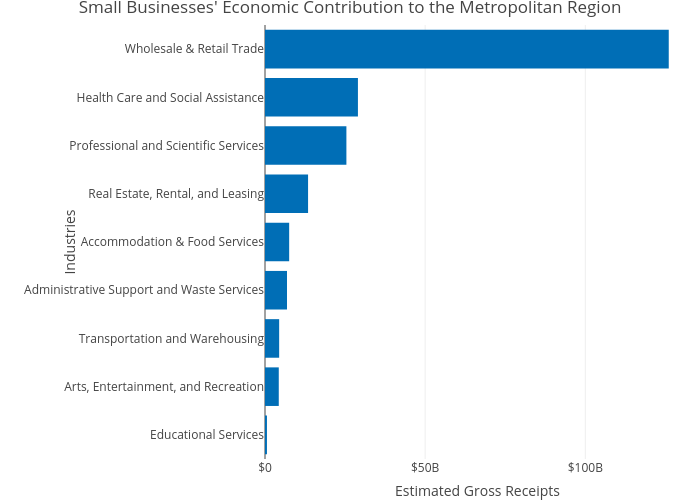
Mshields417's interactive graph and data of "Small Businesses' Economic Contribution to the Metropolitan Region" is a bar chart, showing Small Business Share of Sales,Shipments, and/or Revenue; with Estimated Gross Receipts in the x-axis and Industries in the y-axis.. The x-axis shows values from 0 to 0. The y-axis shows values from 0 to 0.