Edit chart
Loading graph
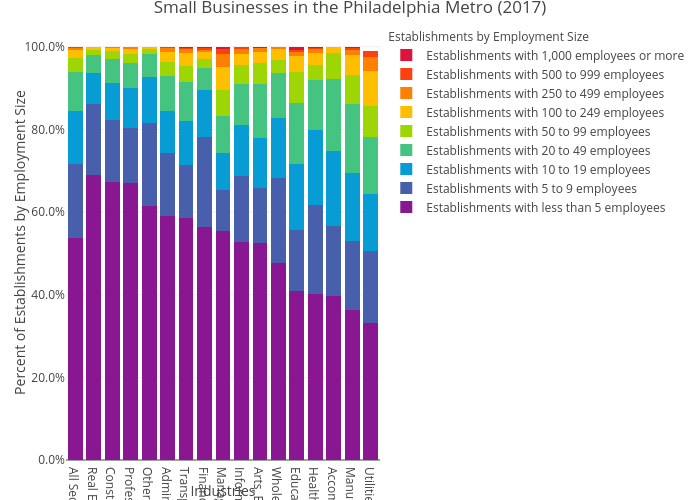
Mshields417's interactive graph and data of "Small Businesses in the Philadelphia Metro (2017)" is a stacked bar chart, showing Establishments with less than 5 employees, Establishments with 5 to 9 employees, Establishments with 10 to 19 employees, Establishments with 20 to 49 employees, Establishments with 50 to 99 employees, Establishments with 100 to 249 employees, Establishments with 250 to 499 employees, Establishments with 500 to 999 employees, Establishments with 1,000 employees or more; with Industries in the x-axis and Percent of Establishments by Employment Size in the y-axis.. The x-axis shows values from 0 to 0. The y-axis shows values from 0 to 0.