Edit chart
Loading graph
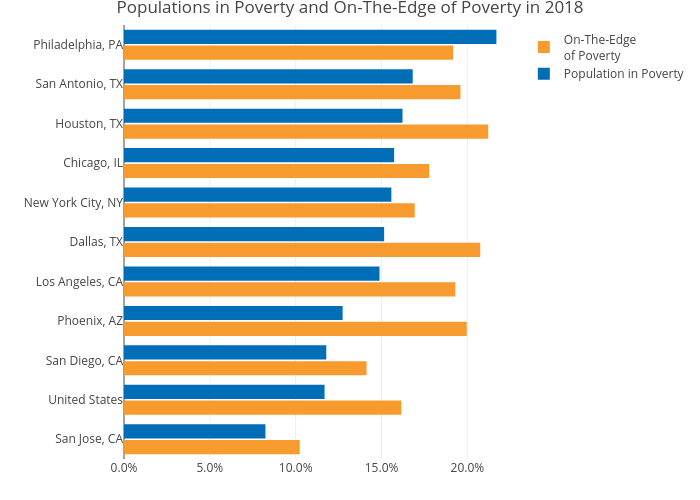
Mshields417's interactive graph and data of "Populations in Poverty and On-The-Edge of Poverty in 2018" is a grouped bar chart, showing On-The-Edgeof Poverty vs Population in Poverty. The x-axis shows values from 0 to 0. The y-axis shows values from 0 to 0.