Edit chart
Loading graph
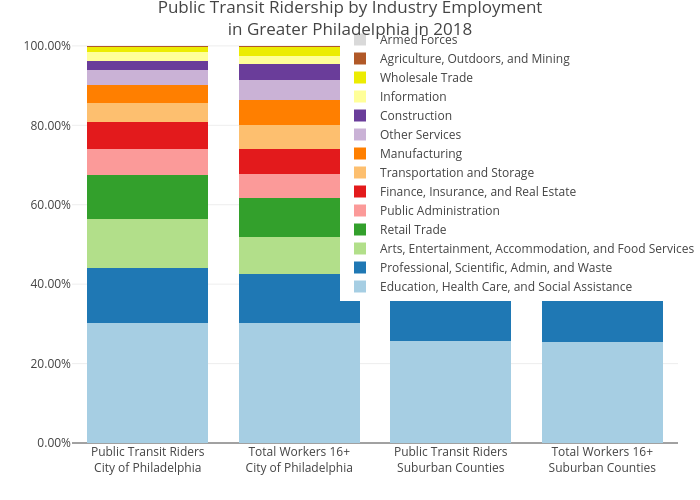
Mshields417's interactive graph and data of "Public Transit Ridership by Industry Employmentin Greater Philadelphia in 2018" is a stacked bar chart, showing Education, Health Care, and Social Assistance, Professional, Scientific, Admin, and Waste, Arts, Entertainment, Accommodation, and Food Services, Retail Trade, Public Administration, Finance, Insurance, and Real Estate, Transportation and Storage, Manufacturing, Other Services, Construction, Information, Wholesale Trade, Agriculture, Outdoors, and Mining, Armed Forces. The x-axis shows values from 0 to 0. The y-axis shows values from 0 to 0.