Edit chart
Loading graph
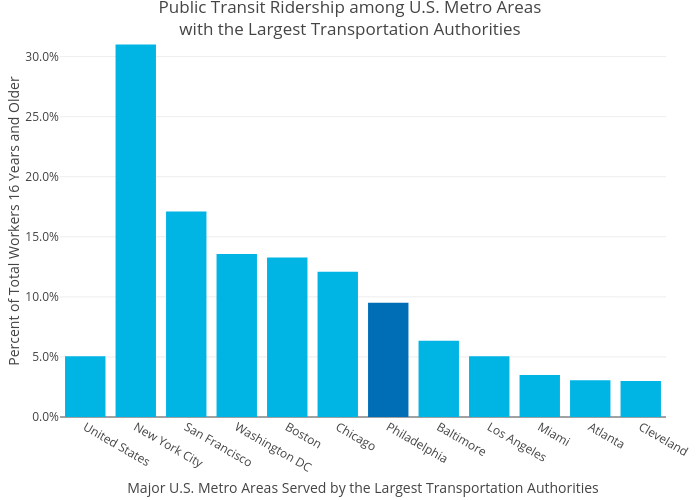
Mshields417's interactive graph and data of "Public Transit Ridership among U.S. Metro Areaswith the Largest Transportation Authorities" is a bar chart, showing #006EB6 vs #00B4E4; with Major U.S. Metro Areas Served by the Largest Transportation Authorities in the x-axis and Percent of Total Workers 16 Years and Older in the y-axis.. The x-axis shows values from 0 to 0. The y-axis shows values from 0 to 0.