Edit chart
Loading graph
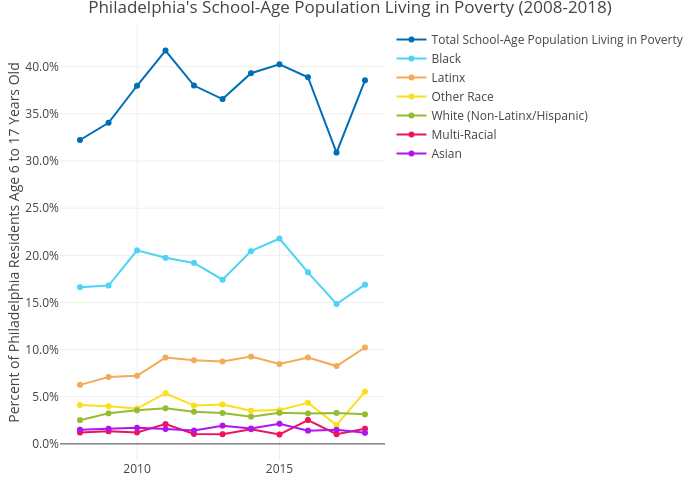
Mshields417's interactive graph and data of "Philadelphia's School-Age Population Living in Poverty (2008-2018)" is a line chart, showing Total School-Age Population Living in Poverty, Black, Latinx, Other Race, White (Non-Latinx/Hispanic), Multi-Racial, Asian; with Percent of Philadelphia Residents Age 6 to 17 Years Old in the y-axis. The x-axis shows values from 0 to 0. The y-axis shows values from 0 to 0.