Edit chart
Loading graph
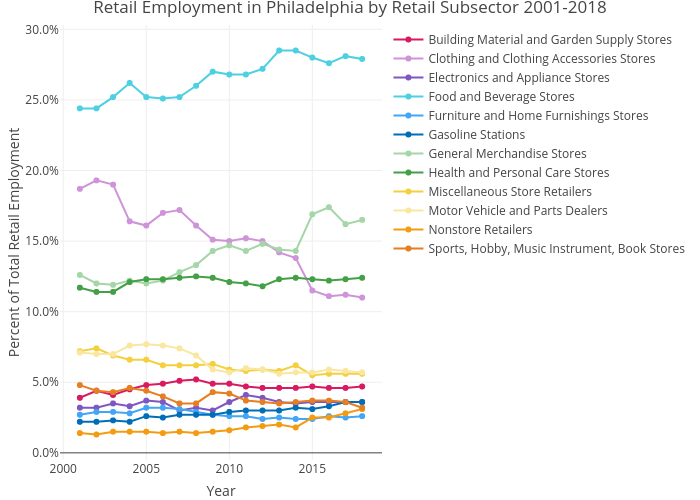
Mshields417's interactive graph and data of "Retail Employment in Philadelphia by Retail Subsector 2001-2018" is a line chart, showing Building Material and Garden Supply Stores, Clothing and Clothing Accessories Stores, Electronics and Appliance Stores, Food and Beverage Stores, Furniture and Home Furnishings Stores, Gasoline Stations, General Merchandise Stores, Health and Personal Care Stores, Miscellaneous Store Retailers, Motor Vehicle and Parts Dealers, Nonstore Retailers, Sports, Hobby, Music Instrument, Book Stores; with Year in the x-axis and Percent of Total Retail Employment in the y-axis.. The x-axis shows values from 0 to 0. The y-axis shows values from 0 to 0.