Edit chart
Loading graph
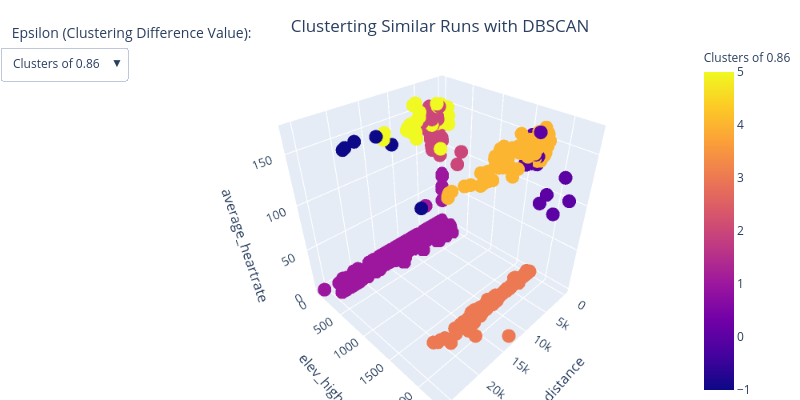
Miles_mena5280's interactive graph and data of "Clusterting Similar Runs with DBSCAN" is a scatter3d; with {} in the y-axis. The x-axis shows values from 0 to 0. The y-axis shows values from 0 to 0. This visualization has the following annotation: Epsilon (Clustering Difference Value):