Edit chart
Loading graph
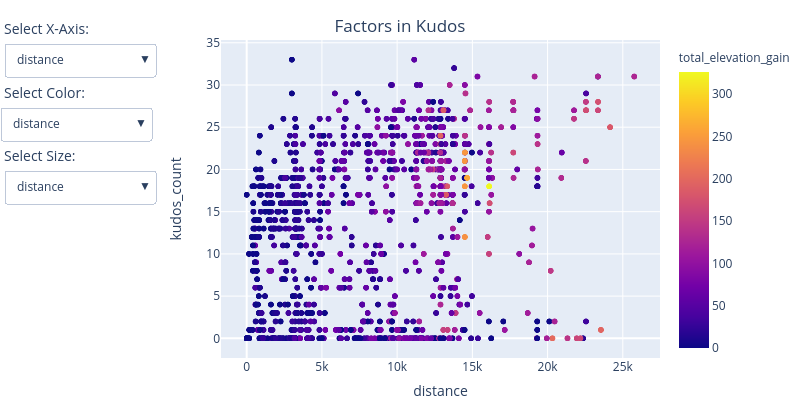
Miles_mena5280's interactive graph and data of "Factors in Kudos " is a scattergl; with distance in the x-axis and kudos_count in the y-axis.. The x-axis shows values from 0 to 0. The y-axis shows values from 0 to 0. This visualization has the following annotations: Select X-Axis:; Select Color:; Select Size: