Edit chart
Loading graph
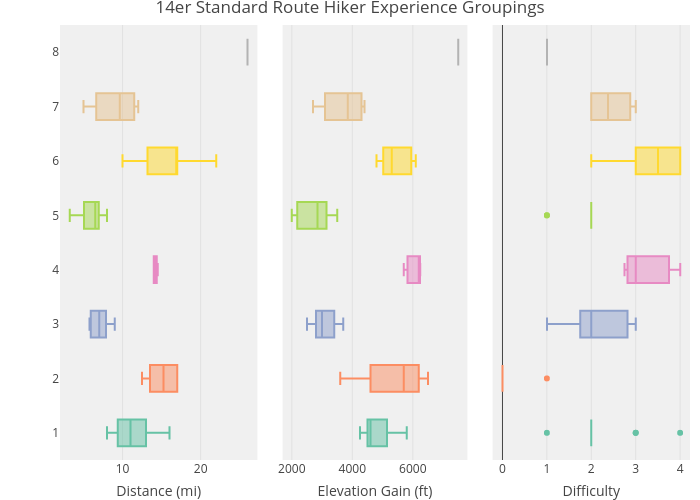
Mikeshout's interactive graph and data of "14er Standard Route Hiker Experience Groupings" is a box plot, showing 1, 2, 3, 4, 5, 6, 7, 8, 1, 2, 3, 4, 5, 6, 7, 8, 1, 2, 3, 4, 5, 6, 7, 8; with Distance (mi) in the x-axis. The x-axis shows values from 1.986111111111111 to 27.26388888888889. The y-axis shows values from 0.5 to 8.5.