Edit chart
Loading graph
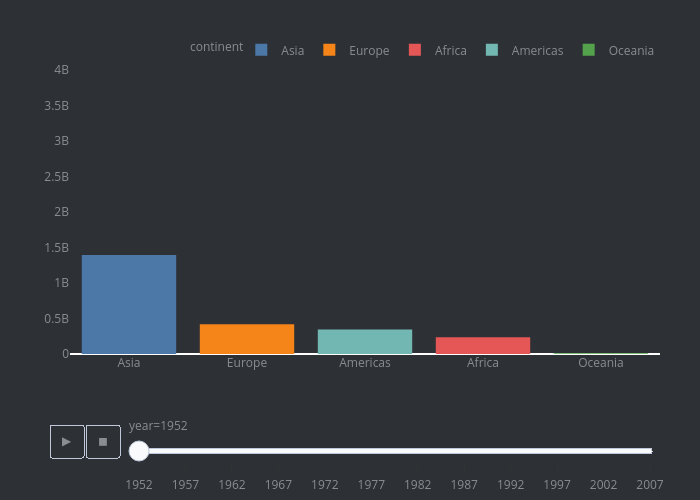
Kashishrastogi2000's interactive graph and data of "{'font': {'size': 25, 'color': '#a5a7ab', 'family': 'Lato, sans-serif'}}" is a histogram, showing Asia, Europe, Africa, Americas, Oceania; with in the x-axis and in the y-axis.. The x-axis shows values from 0 to 0. The y-axis shows values from 0 to 4000000000.