Edit chart
Loading graph
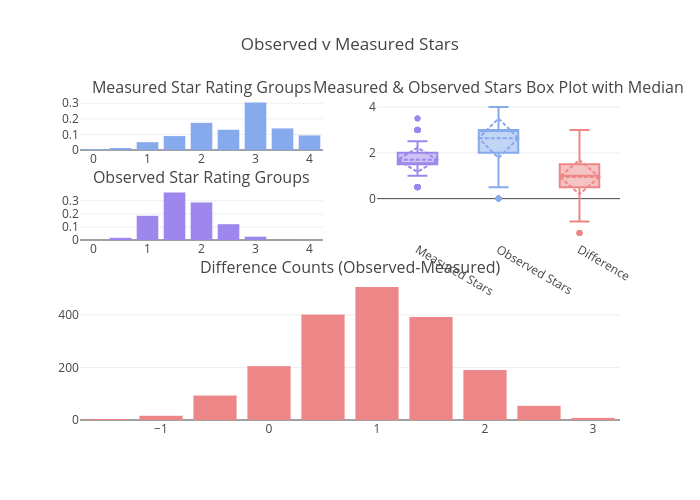
Justdantastic's interactive graph and data of "Observed v Measured Stars" is a bar chart, showing Observed Star Ratings, Measured Star Ratings, Measured Stars, Observed Stars, Difference. The x-axis shows values from 0 to 0. The y-axis shows values from 0 to 0. This visualization has the following annotations: Measured Star Rating Groups; Measured & Observed Stars Box Plot with Median; Observed Star Rating Groups; Difference Counts (Observed-Measured)