Edit chart
Loading graph
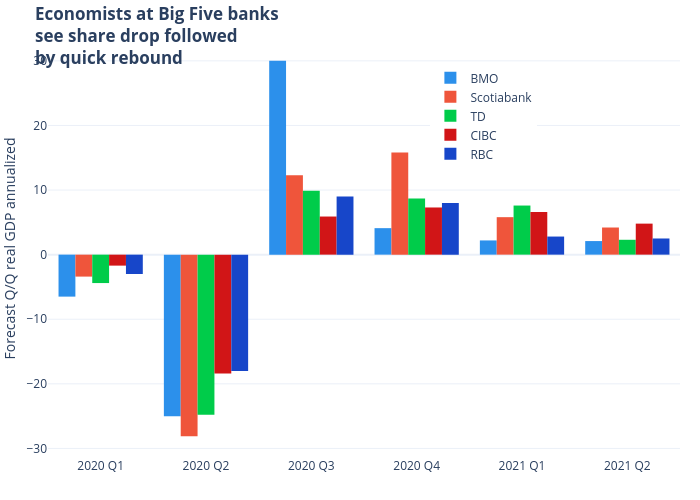
Jasonkirby's interactive graph and data of "Economists at Big Five bankssee share drop followedby quick rebound" is a bar chart, showing BMO, Scotiabank, TD, CIBC, RBC; with Forecast Q/Q real GDP annualized in the y-axis. The x-axis shows values from -0.5 to 5.5. The y-axis shows values from -31.32777777777778 to 33.227777777777774.