Edit chart
Loading graph
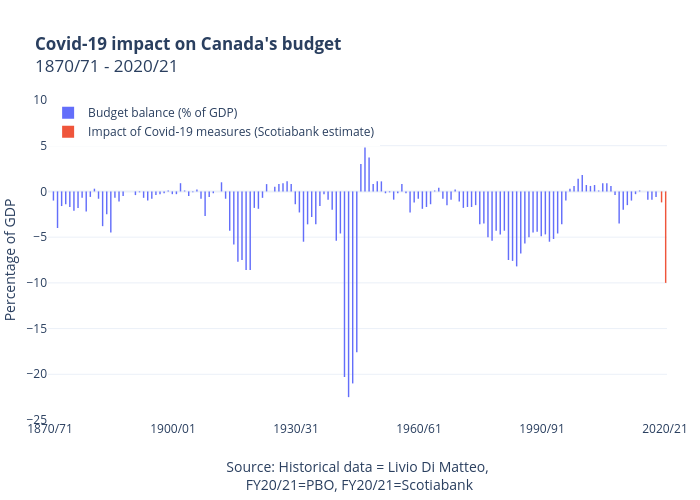
Jasonkirby's interactive graph and data of "Covid-19 impact on Canada's budget1870/71 - 2020/21" is a bar chart, showing Budget balance (% of GDP) vs Impact of Covid-19 measures (Scotiabank estimate); with Source: Historical data = Livio Di Matteo, FY20/21=PBO, FY20/21=Scotiabank in the x-axis and Percentage of GDP in the y-axis.. The x-axis shows values from -0.5 to 150.5. The y-axis shows values from -25 to 10.