Edit chart
Loading graph
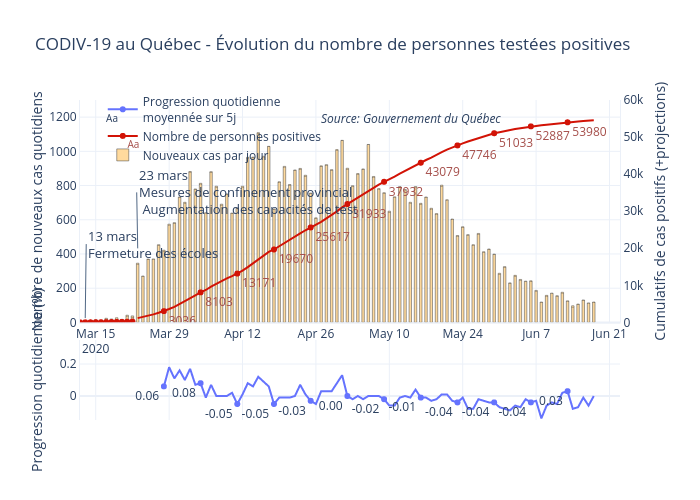
Hoedic's interactive graph and data of "CODIV-19 au Québec - Évolution du nombre de personnes testées positives" is a , showing Nombre de personnes positives(ancienne méthodologie), Nouveaux cas par jour, Nombre de personnes positives, Progression quotidienne moyennée sur 5j; with in the x-axis and Nombre de nouveaux cas quotidiens in the y-axis.. The x-axis shows values from 2020-03-12 00:00:00 to 2020-06-23 . The y-axis shows values from 0 to 1300. This visualization has the following annotations: 13 marsFermeture des écoles; 23 marsMesures de confinement provincial Augmentation des capacités de test; Source: Gouvernement du Québec