Edit chart
Loading graph
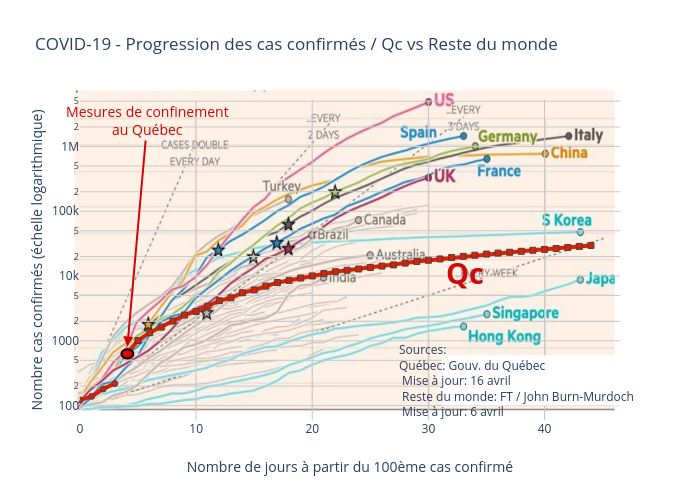
Hoedic's interactive graph and data of "COVID-19 - Progression des cas confirmés / Qc vs Reste du monde" is a , showing Québec - ancienne méthodologie vs Québec - nouvelle méthodologie; with Nombre de jours à partir du 100ème cas confirmé in the x-axis and Nombre cas confirmés (échelle logarithmique) in the y-axis.. The x-axis shows values from 0 to 46.5. The y-axis shows values from 1.872185589820652 to 5.52506673824334. This visualization has the following annotations: Qc; Sources:Québec: Gouv. du Québec Mise à jour: 16 avril Reste du monde: FT / John Burn-Murdoch Mise à jour: 6 avril; Mesures de confinementau Québec