Edit chart
Loading graph
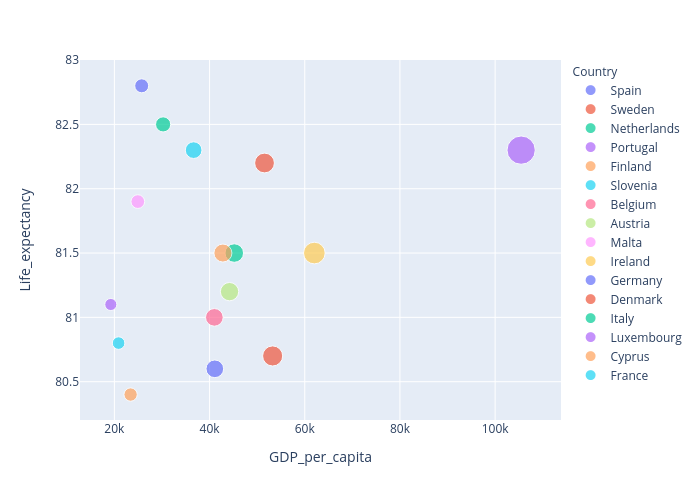
Grumblesoft's interactive graph and data of "Life_expectancy vs GDP_per_capita" is a scatter chart, showing Spain, Sweden, Netherlands, Portugal, Finland, Slovenia, Belgium, Austria, Malta, Ireland, Germany, Denmark, Italy, Luxembourg, Cyprus, France; with GDP_per_capita in the x-axis and Life_expectancy in the y-axis.. The x-axis shows values from 0 to 0. The y-axis shows values from 0 to 0.