Edit chart
Loading graph
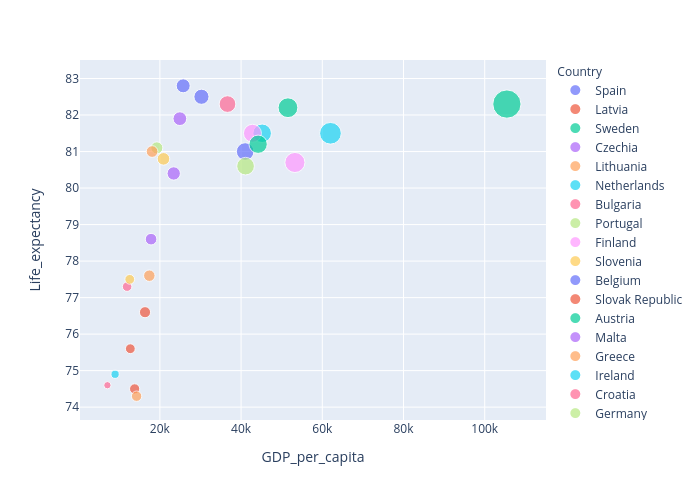
Grumblesoft's interactive graph and data of "Life_expectancy vs GDP_per_capita" is a scatter chart, showing Spain, Latvia, Sweden, Czechia, Lithuania, Netherlands, Bulgaria, Portugal, Finland, Slovenia, Belgium, Slovak Republic, Austria, Malta, Greece, Ireland, Croatia, Germany, Denmark, Poland, Italy, Hungary, Luxembourg, Cyprus, Estonia, Romania, France; with GDP_per_capita in the x-axis and Life_expectancy in the y-axis.. The x-axis shows values from 0 to 0. The y-axis shows values from 0 to 0.