Edit chart
Loading graph
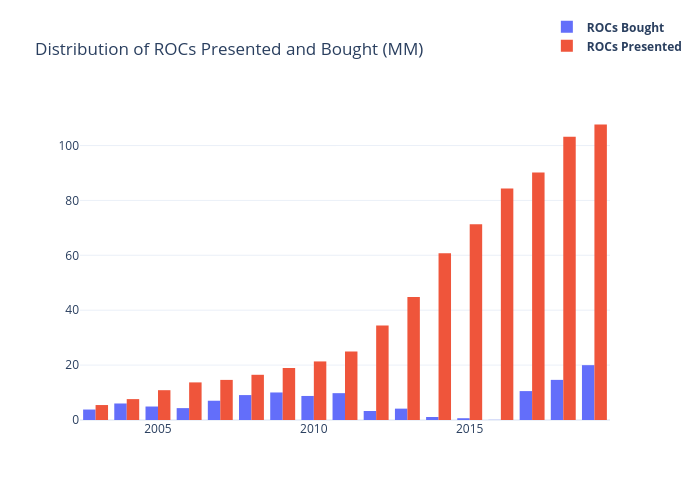
Gmontano's interactive graph and data of "Distribution of ROCs Presented and Bought (MM)" is a bar chart, showing ROCs Bought vs ROCs Presented; with time in the x-axis. The x-axis shows values from 2002-07-02 12:00 to 2019-07-02 12:00. The y-axis shows values from 0 to 113.30526315789474.