Edit chart
Loading graph
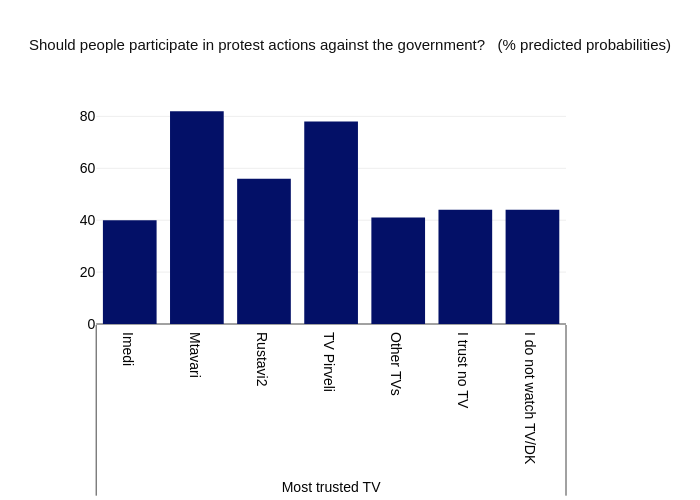
Givisilll's interactive graph and data of "Should people participate in protest actions against the government? (% predicted probabilities)" is a bar chart. The x-axis shows values from -0.5 to 6.5. The y-axis shows values from 0 to 86.3157894736842.