Edit chart
Loading graph
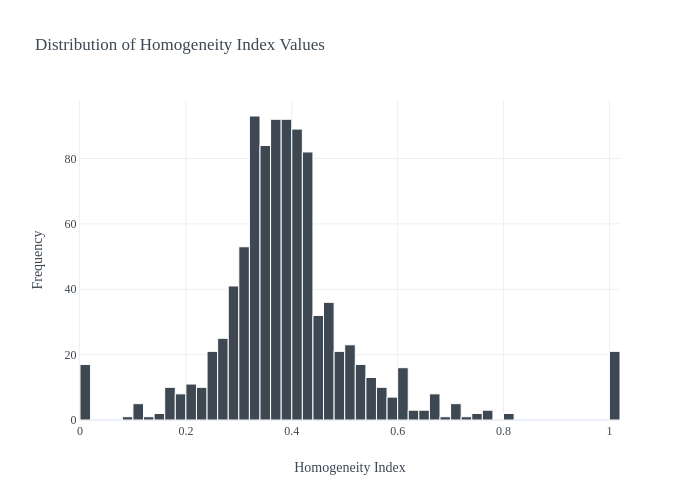
Elevenso's interactive graph and data of "Distribution of Homogeneity Index Values" is a histogram; with Homogeneity Index in the x-axis and Frequency in the y-axis.. The x-axis shows values from 4.683753385137379e-17 to 1.0200000000000005. The y-axis shows values from 0 to 97.89473684210526.