Edit chart
Loading graph
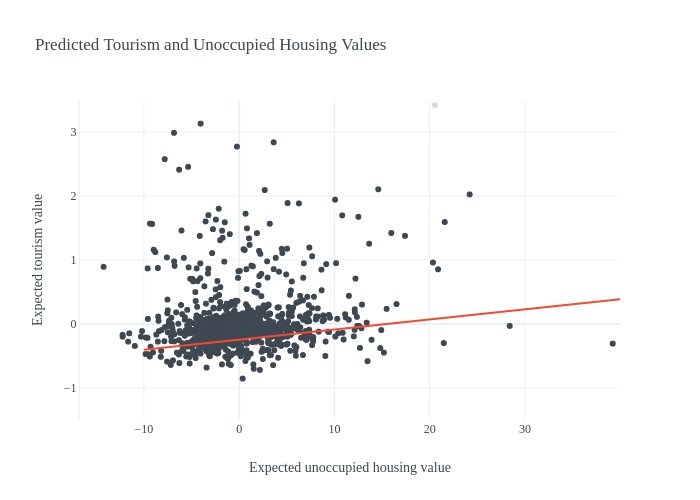
Elevenso's interactive graph and data of "Predicted Tourism and Unoccupied Housing Values" is a scatter chart; with Expected unoccupied housing value in the x-axis and Expected tourism value in the y-axis.. The x-axis shows values from -16.700688524122807 to 39.97205704605262. The y-axis shows values from -1.5 to 3.5. This visualization has the following annotation: coefficient = .01576672, (robust) standard error = .00404858, t-statistic = 3.89