Edit chart
Loading graph
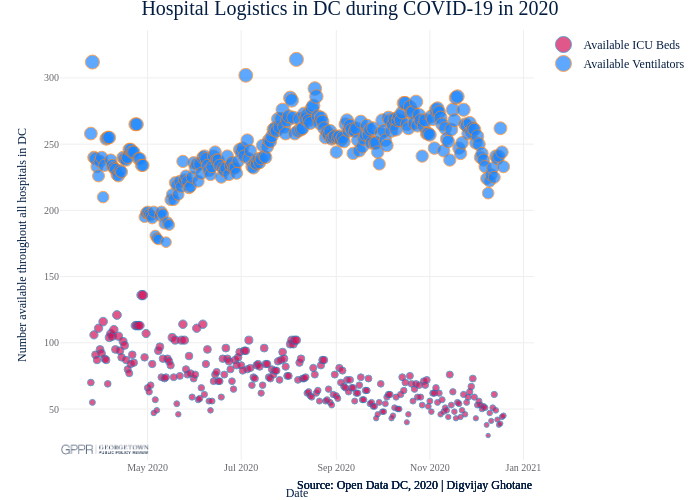
Digvijayghotane's interactive graph and data of "Hospital Logistics in DC during COVID-19 in 2020" is a scatter chart, showing Available ICU Beds vs Available Ventilators; with Date in the x-axis and Number available throughout all hospitals in DC in the y-axis.. The x-axis shows values from 2020-03-07 13:51:23.245 to 2021-01-05 07:29:37.7437. The y-axis shows values from 12.309486865067587 to 334.2927394259064. This visualization has the following annotations: Source: Open Data DC, 2020 | Digvijay Ghotane; Source: Open Data DC, 2020 | Digvijay Ghotane; Source: Open Data DC, 2020 | Digvijay Ghotane