Edit chart
Loading graph
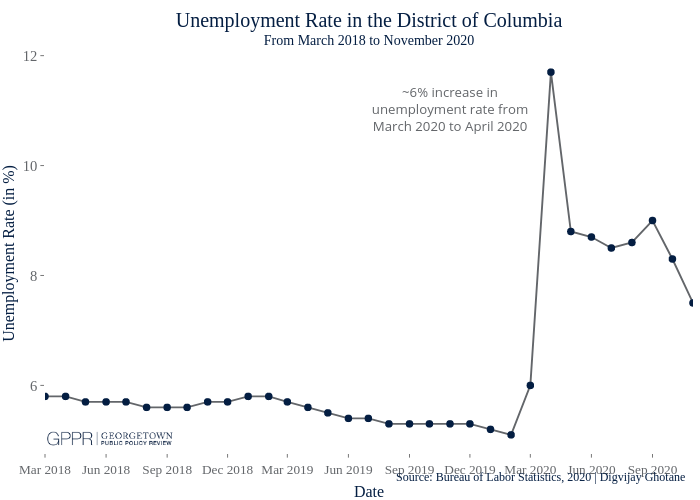
Digvijayghotane's interactive graph and data of "Unemployment Rate in the District of ColumbiaFrom March 2018 to November 2020" is a line chart; with Date in the x-axis and Unemployment Rate (in %) in the y-axis.. The x-axis shows values from 17591 to 18567. The y-axis shows values from 4.77 to 12.03. This visualization has the following annotation: Source: Bureau of Labor Statistics, 2020 | Digvijay Ghotane