Edit chart
Loading graph
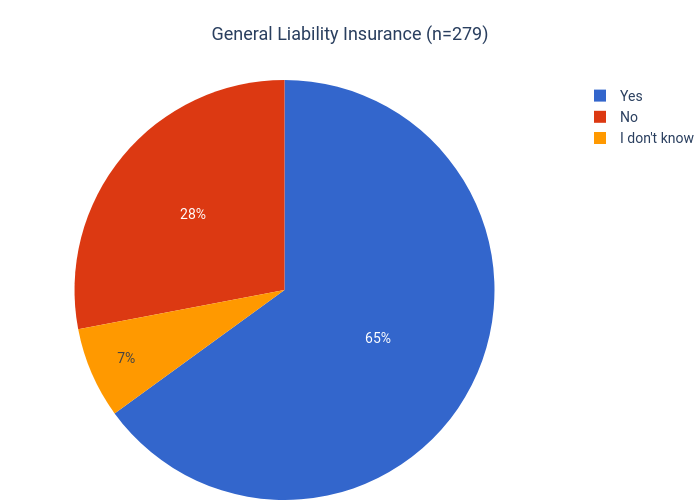
Dancenyc's interactive graph and data of "General Liability Insurance (n=279)" is a pie. The x-axis shows values from -1 to 6. The y-axis shows values from -1 to 4.