Edit chart
Loading graph
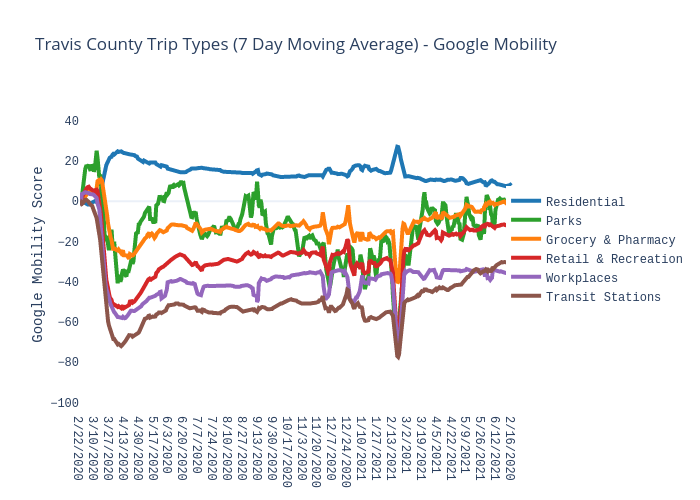
Charlie2343's interactive graph and data of "Travis County Trip Types (7 Day Moving Average) - Google Mobility" is a scatter chart, showing Residential, Parks, Grocery & Pharmacy, Retail & Recreation, Workplaces, Transit Stations; with {'font': {'family': 'Courier New'}} in the x-axis and Google Mobility Score in the y-axis.. The x-axis shows values from 0 to 494. The y-axis shows values from -102.52313652733821 to 49.52313652733821.