Edit chart
Loading graph
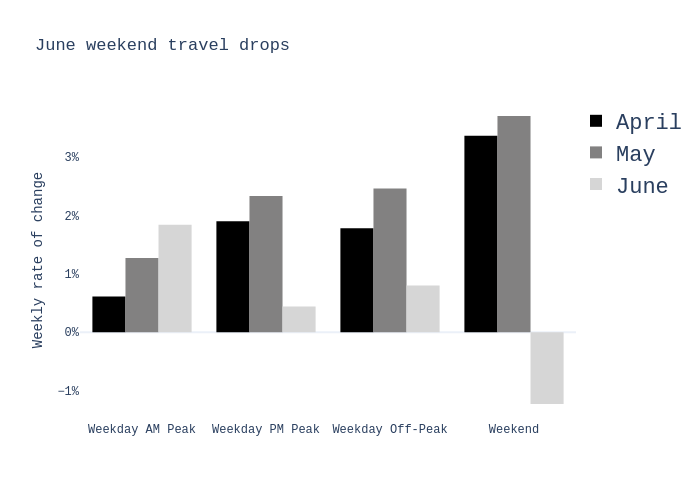
Charlie2343's interactive graph and data of "June weekend travel drops" is a grouped bar chart, showing April, May, June; with Weekly rate of change in the y-axis. The x-axis shows values from -0.5 to 3.5. The y-axis shows values from -1.5038888888888888 to 3.9738888888888892.